Note: This was originally published on the MongoDB Engineering Blog on April 30, 2019 here by Henrik Ingo and myself. Please read it there assuming the link works. I have copied it here to ensure the content does not disappear. The links in the article are the original links.
In an effort to improve repeatability, the MongoDB Performance team set out to reduce noise on several performance test suites run on EC2 instances. At the beginning of the project, it was unclear whether our goal of running repeatable performance tests in a public cloud was achievable. Instead of debating the issue based on assumptions and beliefs, we decided to measure noise itself and see if we could make configuration changes to minimize it.
We already built up knowledge around fine-tuning CPU options when setting up another class of performance benchmarks (single node benchmarks). That work had shown us that CPU options could also have a large impact on performance. Additionally, it left us familiar with a number of knobs and options we could adjust.
Knob
Where to set
Setting
What it does
Idle Strategy
Kernel Boot
idle=poll
Puts linux into a loop when idle, checking for work.
Max sleep state (c4 only)
Kernel Boot
intel_idle.max_cstate=1 intel_pstate=disable
Disables the use of advanced processor sleep states.
CPU Frequency
Command Line
sudo cpupower frequency-set -d 2.901GHz
Sets a fixed frequency. Doesn't allow the CPU to vary the frequency for power saving.
Hyperthreading
Command Line
echo 0 > /sys/devices/system/ cpu/cpu$i/online
Disables hyperthreading. Hyperthreading allows two software threads of execution to share one physical CPU. They compete against each other for resources.
We added some CPU specific tests to measure CPU variability. These tests allow us to see if the CPU performance is noisy, independently of whether that noise makes MongoDB performance noisy. For our previous work on CPU options, we wrote some simple tests in our C++ harness that would, for example:
multiply numbers in a loop (cpu bound)
sleep 1 or 10 ms in a loop
Do nothing (no-op) in the basic test loop
We added these tests to our System Performance project. We were able to run the tests on the client only, and going across the network.
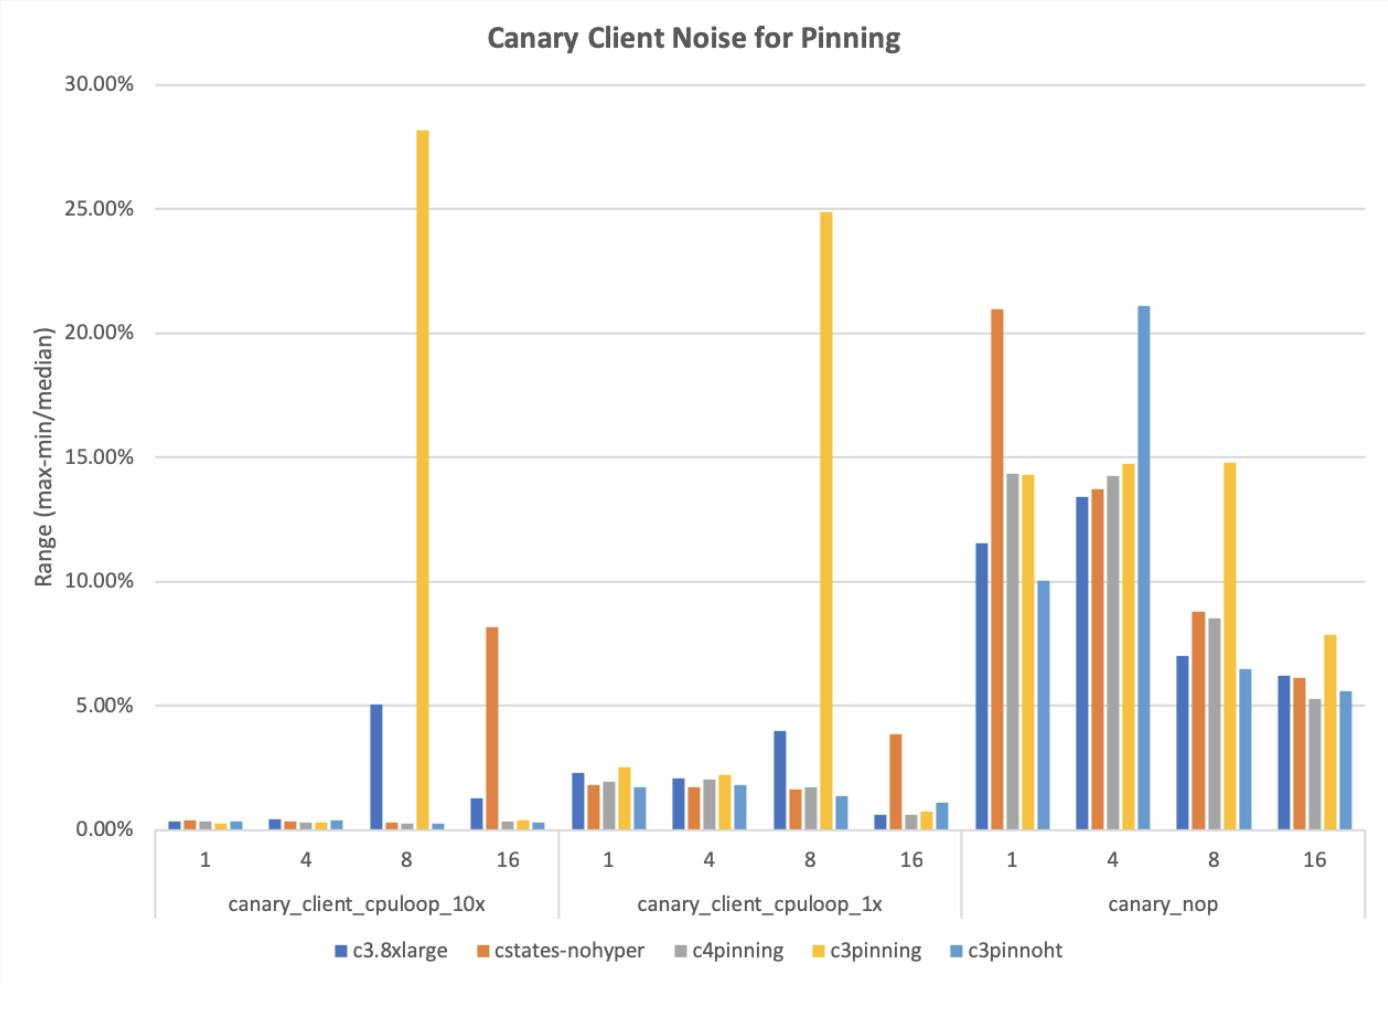
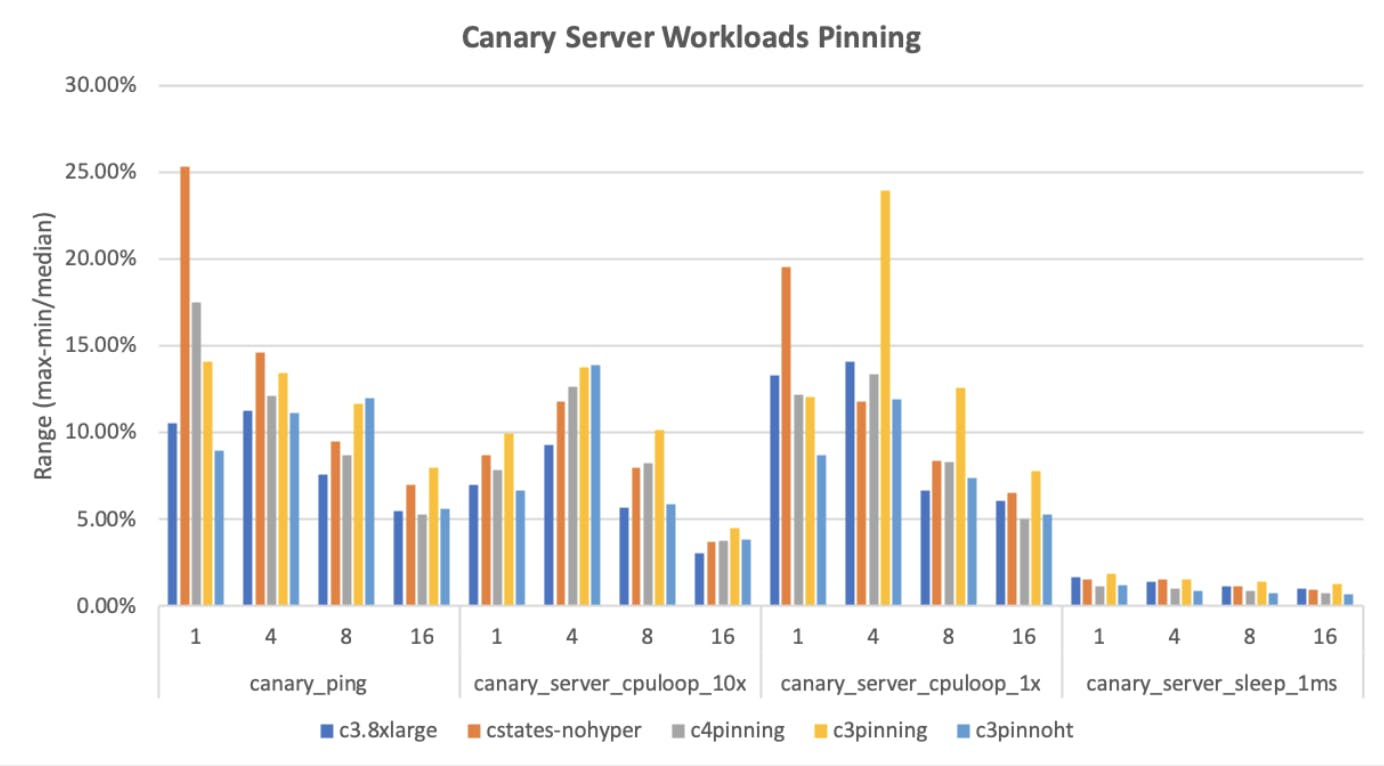
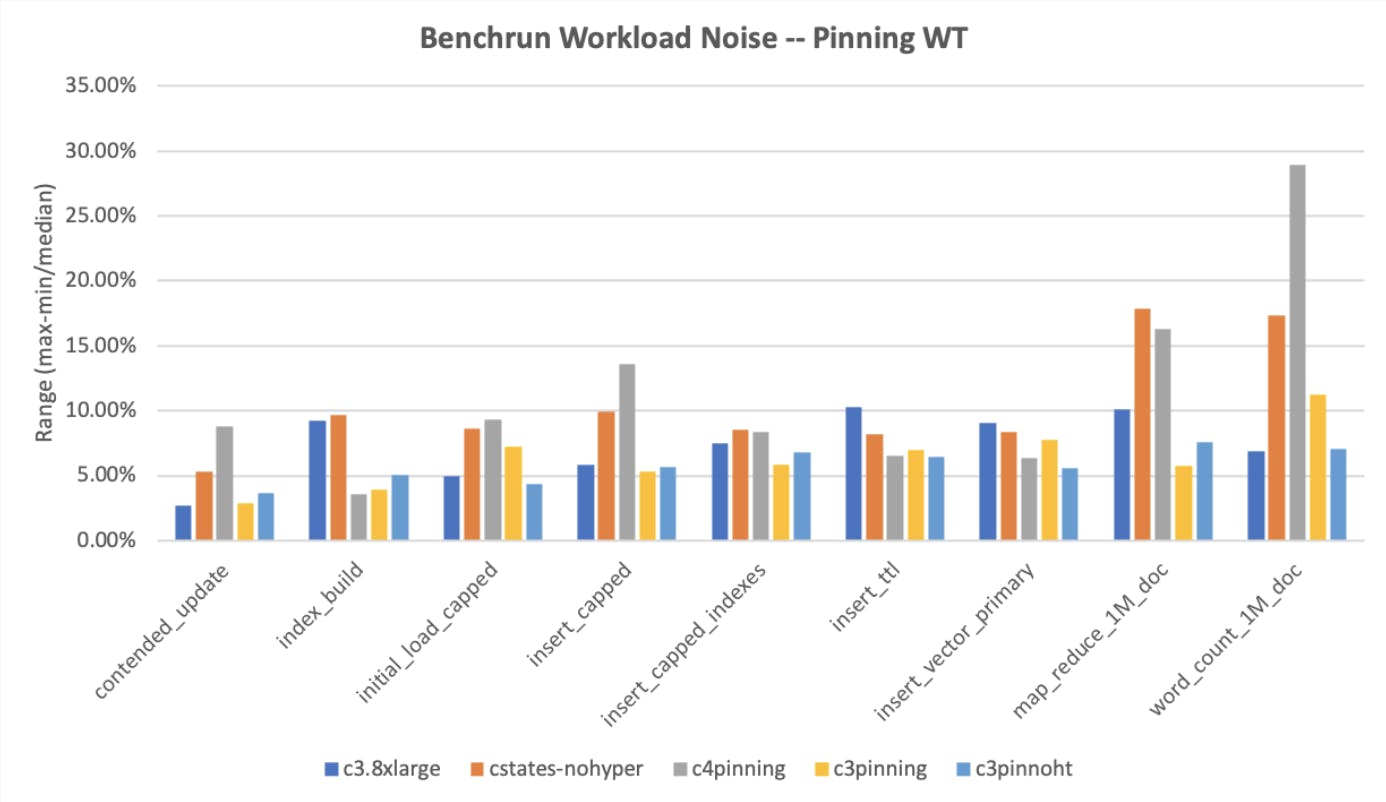
We ran our tests 5x5 times, changing one configuration at a time, and compared the results. The first two graphs below contain results for the CPU-focused benchmarks, the third contains the MongoDB-focused benchmarks. In all the below graphs, we are graphing the "noise" metric as a percentage computed from (max-min)/median and lower is better.
We start with our focused CPU tests, first on the client only, and then connecting to the server. We’ve omitted the sleep tests from the client graphs for readability, as they were essentially 0.
Results for CPU-focused benchmarks with different CPU options enabled
The nop test is the noisiest test all around, which is reasonable because it’s doing nothing in the inner loop. The cpu-bound loop is more interesting. It is low on noise for many cases, but has occasional spikes for each case, except for the case of the c3.8xlarge with all the controls on (pinned to one socket, hyperthreading off, no frequency scaling, idle=poll).
Results for tests run on server with different CPU options enabled
When we connect to an actual server, the tests become more realistic, but also introduce the network as a possible source of noise. In the cases in which we multiply numbers in a loop (cpuloop) or sleep in a loop (sleep), the final c3.8xlarge with all controls enabled is consistently among the lowest noise and doesn’t do badly on the ping case (no-op on the server). Do those results hold when we run our actual tests?
Results for tests run on server with different CPU options enabled
Yes, they do. The right-most blue bar is consistently around 5%, which is a great result! Perhaps unsurprisingly, this is the configuration where we used all of the tuning options: idle=poll, disabled hyperthreading and using only a single socket.
We continued to compare c4 and c3 instances against each other for these tests. We expected that with the c4 being a newer architecture and having more tuning options, it would achieve better results. But this was not the case, rather the c3.8xlarge continued to have the smallest range of noise. Another assumption that was wrong!
We expected that write heavy tests, such as batched inserts, would mostly benefit from the more stable IOPS on our new EBS disks, and the CPU tuning would mostly affect cpu-bound benchmarks such as map-reduce or index build. Turns out this was wrong too - for our write heavy tests, noise did not in fact predominantly come from disk.
The tuning available for CPUs has a huge effect on threads that are waiting or sleeping. The performance of threads that are actually running full speed is less affected - in those cases the CPU runs at full speed as well. Therefore, IO-heavy tests are affected a lot by CPU-tuning!
Disabling CPU options in production
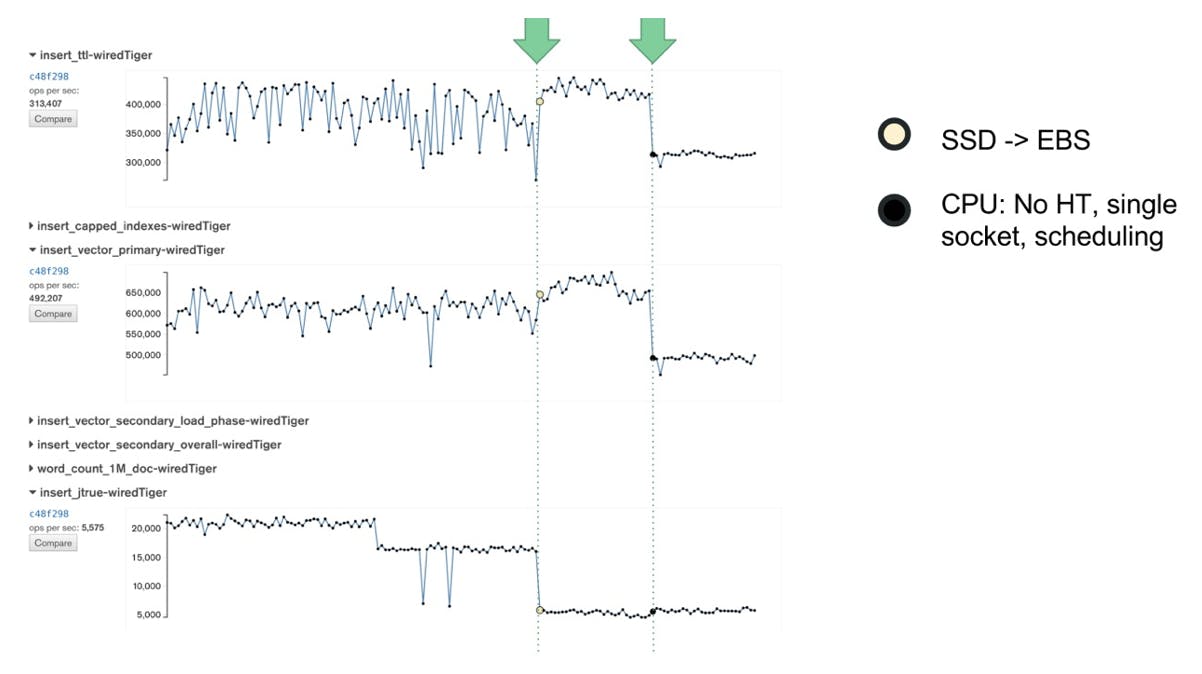
Deploying these configurations into production made insert tests even more stable from day to day:
Improvements in daily performance measurements through changing to EBS and disabling CPU options
Note that the absolute performance of some tests actually dropped, because the number of available physical CPUs dropped by ½ due to only using a single socket, and disabling hyperthreading causes a further drop, though not quite a full half, of course.
Conclusion
Drawing upon prior knowledge, we decided to fine tune CPU options. We had previously assumed that IO-heavy tests would have a lot of noise coming from disk and that CPU tuning would mostly affect CPU-bound tests. As it turns out, the tuning available for CPUs actually has a huge effect on threads that are waiting or sleeping and therefore has a huge effect on IO-heavy tests. Through CPU tuning, we achieved very repeatable results. The overall measured performance in the tests decreases but this is less important to us. We care about stable, repeatable results more than maximum performance.
Note: This was originally published on the MongoDB Engineering Blog on January 30, 2023 here. Please read it there assuming the link works. I have copied it here to ensure the content does not disappear.
At MongoDB, we want to (honestly) tell our users that each new version of our software is faster than the previous version. We also want to be able to explain why. We definitely do not want to learn that a release is slower (we have a performance regression) from our customers telling us after discovering it for themselves. In order to do this, we need to understand the performance of our software, detect performance changes early, and aggressively redress the root cause.
We have invested significantly into building a performance testing system to achieve these goals. This includes creating a large number of performance tests, automating the running of those tests, and building tools to diagnose performance regressions when we find them. Those tools and tests are not enough by themselves: they produce an overwhelming amount of data. That data needs to be analyzed to determine if the performance changed. We could not process it all. We have developed new tools to process the data, using advanced statistical techniques to detect real performance regressions and identify the causes of those regressions.
Where we started
We built our original performance testing system in 2015. It ran a collection of performance tests directly in our CI system (Evergreen). We automated every step of running a test and collecting the results. That left the hard part: making sense of the results.
Computers are fascinating things, built up from a huge number of simple and deterministic components. However, the interactions between those simple components lead to the emergence of non-deterministic behavior. As computers get more complex, the emergent behavior becomes more pronounced. The net effect is that when you run a program twice, the two executions will differ (i.e. one may take longer), even when run on the same machine.
The problem gets even harder when you go from running on a single computer, to multiple computers in a distributed system. Network latencies will vary depending on the state of the network switches and other traffic on the network. The combination of each computer's variability combined with the variability of the network leads to more variability. MongoDB is a distributed system. When we test the performance of MongoDB, we have to address all of these issues.
For performance tests, these differences show up as different measurements of performance. Your program may take more or less time to run. It may execute more or fewer operations within a period of time. You may see more or fewer slow operations. We call this phenomenon run to run variation or measurement noise. Run to run variation makes it harder to determine if changes to the software made the software intrinsically faster or slower. Thus, we did an enormous amount of work to limit the measurement noise in our tests, both in the original project, and in subsequent projects.
Still, no matter how hard anyone tries, there will always be run to run variation. This presents a challenge when we want to interpret our performance results (or if you want to interpret your performance results). Maybe we are comparing two versions of our software and want to know which one is faster. If we have results that are 5% faster on the new version, is that due to our software being 5% faster? Or is the 5% due to run to run variation? Or worse, is the 5% change due to 10% run to run variation combined with our software actually being 5% slower?
When we started, we only had a few performance tests. We manually inspected the results and could understand if and when the performance changed. However, as we added more tests, and more results per test, human inspection became less effective: we missed things and it was hard and unsatisfying work.
We automated comparing the performance of one version of the software to another very early in the development of our system. We wrote software to compare the new performance results to older performance results. If the results changed more than 10%, we flagged it and had a human look at it.
Using a direct comparison was common practice in the industry. It was also awful. The comparisons missed small regressions, they flagged a lot of false positives on noisier tests, and sometimes they flagged real things, but at the wrong time. The automated comparisons were much better than manual inspection, but still awful.
We continually built improvements to make the system less awful. We had a system to increase the comparison threshold (from 10%) for noisier tests, and a system to reset the comparison when there was a change in performance (i.e., compare to the new normal). These changes improved the system, but they did not fundamentally overcome the challenges we faced.
Solving the right problem
Along the way, we realized we were trying to solve the wrong problem. Our automated comparison was answering the question: “Has measured performance changed more than 10% between these two versions of software”. What we really wanted to answer was “Which software changes altered performance (for better or worse)”. Those two questions overlap for large performance changes in low noise environments, but they differ on noisy tests or for small changes in performance.
The second question (“which software changes altered performance?”) focuses on detecting changes in a measured value over time. This question maps to a known problem called change point detection. Change point detection is the problem of finding when changes in values occurred in time (time-series) in the presence of noise or other confounding variables. For example, it’s used to detect changes in behavior on such things as electricity consumption, population totals, local weather, and stock prices. There’s a lot of existing work on change point detection, so we just needed to pick the best existing work, implement it, and put it into production. Simple, right?
Well, maybe not. We did not know what was the best existing work, and we did not know if it would fix our problems. So, we did some research, identifying likely techniques and collecting papers on them. The papers accumulated and stayed on my desk, because I didn’t have time to dive into a speculative project when there were plenty of things that needed to be done NOW.
Enter an intern
During the summer of 2017, two interns joined us on the performance team. They spent the summer working with us on our performance testing infrastructure. Both of them were great, giving our work an extra push forward.
We encourage our interns to learn and grow. One way we do this is by explaining what we are doing and why we are doing it. We explain the larger context of the work. This naturally leads to discussing open challenges. One of our interns asked if they could read that stack of papers sitting on my desk (of course they could). Towards the end of the summer, he had completed his summer project early. Further, he had read the papers, understood them, and asked if he could make a prototype! In particular, he had gone through the complex math of the papers, and figured out how that math could be implemented in software.
He built a prototype. It was limited, but it proved that the concept could work. The algorithm clearly found the changes in the sample traces we created, and did not get confused when run on sample data containing random background noise. Based on this initial success, we scheduled a larger proof of concept project to integrate the algorithm with our production system. We compared this second proof of concept with the existing comparison code, and determined it was MUCH better. We then did the work to get the algorithm in production and update our processes to use it.
Our production system today
When we started in 2015, we ran only a handful of tests and only a handful of people used the performance infrastructure directly. Today we run hundreds of distinct performance tests, generating over 100k distinct results per software commit. Today, everyone who develops MongoDB interacts with our performance testing infrastructure.
When a developer commits a change to MongoDB, tests are run. Upon completion, change point detection is used to detect performance changes (improvements and regressions). A dedicated team triages these changes, isolates them to specific commits, and assigns these changes to developers to investigate. In the case of improvements, the developers confirm that the change was expected, or investigate the change to understand why the performance got better. Sometimes things get faster because of bugs – we have found bugs this way.
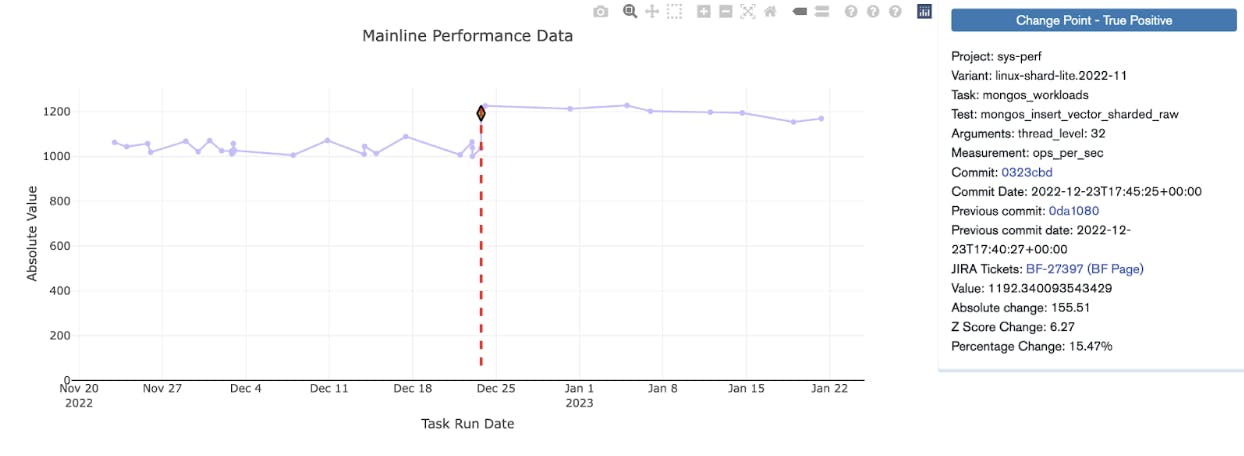
Trend graph for a performance test in MongoDB. The green diamond marks the detected change point that has been triaged and confirmed. This was a recent 15% improvement in bulk insert performance for sharded clusters.
Our system is good at detecting regressions and our engineers are good at fixing them. Even better than fixing a regression, is preventing a performance regression from ever being committed to our development branch. Developers can test their proposed changes before committing the changes, using something called a patch build. In this way, the developers can make sure they are not introducing new performance regressions, verify a fix, or confirm an optimization before committing their code.
Advancing science!
At MongoDB we take pride in developing a database and a database platform that empowers developers to make applications that change the world. We depend on our performance testing infrastructure to ensure we ship a performant database. We are proud of the performance infrastructure we have built and the impact it has had on the software we ship to our users.
We do not do any of this work in a void. At MongoDB we benefit from being part of several communities, and we want to support these communities. It is for this reason that most of our database source code is publicly available and our JIRA project for database development is also public.
These talks and presentations have helped the community, but they have also helped us. By sharing and participating in the community, we have more people thinking about our problems. We’ve had the best minds in performance engineering in academia sharing ideas and suggestions with us on how to improve our technology!
Often the ideas build on each other. One such idea led to the creation of the Data Challenge Track at ICPE in 2022. Building on our papers, we were able to open up our performance test results as a shareable artifact. The data challenge itself was simple: do something interesting with our performance test data. Researchers were thrilled to have industry data to evaluate and demonstrate their ideas. We were thrilled to have researchers working on our problems. In the end, it led to four strong papers which have impacted how we test performance at MongoDB.
We continue to work on sharing our data and learnings. We have an ongoing collaboration within the SPEC Research Group to create better datasets and algorithms for detecting performance regressions. The group is combining our data with other industry datasets and curating the data. The results will enable researchers to understand the performance and accuracy of current algorithms, test new algorithms, and clearly show any improvements. All using real industry data from us and other companies.
In each of these interactions, the community wins and we win. By sharing our data we enable better research, we get to take advantage of that research, and the research is better aligned with our needs.
Investing in the future
Of the two interns mentioned in this post, one is now a full time employee of MongoDB, and the other is pursuing a Ph.D. in computer science at Columbia. One is directly improving our software, and the other one is improving the theory and tools we use to build our software. We are very proud of both of them.
The MongoDB database is faster today because of their work on our performance testing infrastructure. Thanks to that infrastructure we better understand why the database performs the way it does, why that performance changes, and when that performance changes.
We continue to invest in and improve this critical piece of our infrastructure. We have teams dedicated to extending and improving it. We lean into our academic interactions to improve the state of the art for everyone. And we invest in the people who work on these systems (interns included).
We hope you consider using these techniques yourself and letting us and the community know how it goes for you. If you are an academic, please improve the theoretical underpinnings of this entire space – we are happy to talk to you about it. And if the problems and software described in this post sounded interesting to you, we are hiring! Come join us and help us solve these problems.
Note: This was originally published on the MongoDB Engineering Blog on April 30, 2019 here by Henrik Ingo and myself. Please read it there assuming the link works. I have copied it here to ensure the content does not disappear. The links in the article are the original links.
In an effort to improve repeatability, the MongoDB Performance team set out to reduce noise on several performance test suites run on EC2 instances. At the beginning of the project, it was unclear whether our goal of running repeatable performance tests in a public cloud was achievable. Instead of debating the issue based on assumptions and beliefs, we decided to measure noise itself and see if we could make configuration changes to minimize it.
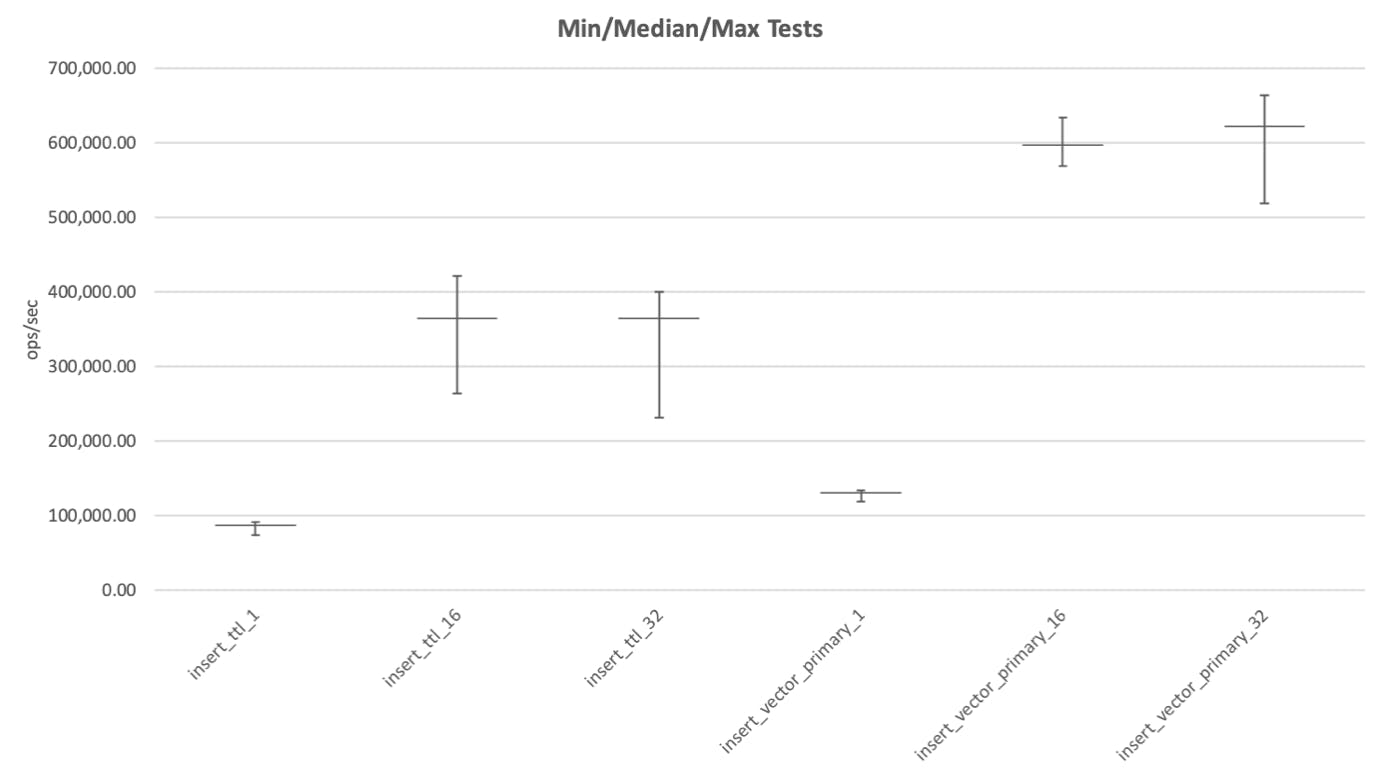
Our first experiment created a lot of data that we sifted through with many graphs. We started with graphs of simple statistics from repeated experiments: the minimum, median, and maximum result for each of our existing tests. The graphs allowed us to concisely see the range of variation per test, and which tests were noisy. Here is a representative graph for batched insert tests:
High variance in the performance of batched insert tests
In this graph you have two tests, each run three times at different thread levels (this is the integer at the end of the test name). The whiskers around the median, denote the minimum and maximum results (from the 25 point sample).
Looking at this graph we observe that thread levels for these two tests aren't optimally configured. When running these two tests with 16 and 32 parallel threads, the threads have already saturated MongoDB, and the additional concurrency merely adds noise to the results. We noticed other configuration problems in other tests. We didn't touch the test configurations during this project, but later, after we had found a good EC2 configuration, we did revisit this issue and reviewed all test configurations to further minimize noise. Lesson learned: When you don't follow the disciplined approach of "Measure everything. Assume nothing." from the beginning, probably more than one thing has gone wrong.
EC2 instances are neither good nor bad
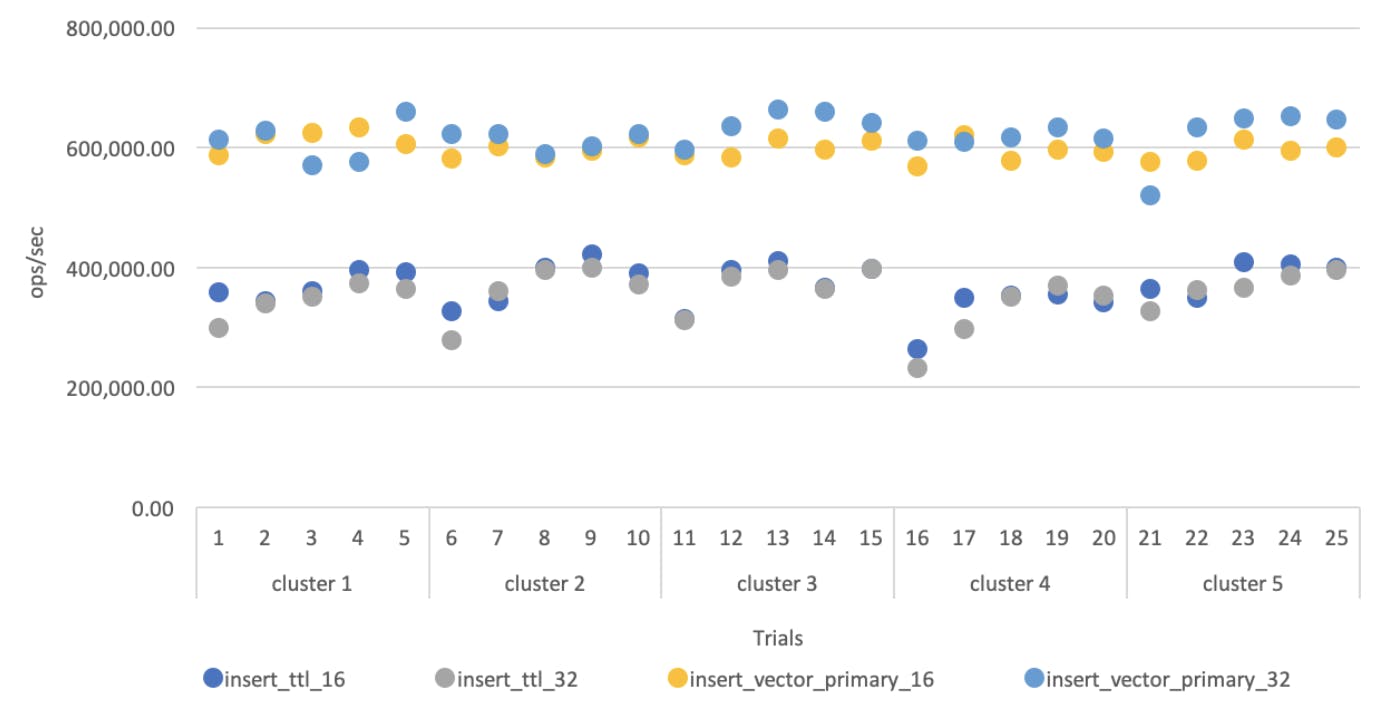
We looked at the first results in a number of different ways. One way showed us the results from all 25 trials in one view:
Performance results do not correlate with the clusters they are run on
As we examined the results, one very surprising conclusion immediately stood out from the above graph: There are neither good nor bad EC2 instances.
When we originally built the system, someone had read somewhere on the internet that on EC2 you can get good and bad instances, noisy neighbours, and so on. There are even tools and scripts you can use to deploy a couple instances, run some smoke tests, and if performance results are poor, you shut them down and try again. Our system was in fact doing exactly that, and on a bad day would shut down and restart instances for 30 minutes before eventually giving up. (For a cluster with 15 expensive nodes, that can be an expensive 30 minutes!)
Until now, this assumption had never been tested. If the assumption had been true, then on the above graph you would expect to see points 1-5 have roughly the same value, followed by a jump to point 6, after which points 6-10 again would have roughly the same value, and so on. However, this is not what we observe. There's a lot of variation in the test results, but ANOVA tests confirm that this variation does not correlate with the clusters the tests are run on. From this data, it appears that there is no evidence to support that there are good and bad EC2 instances.
Note that it is completely possible that this result is specific to our system. For example, we use (and pay extra for) dedicated instances to reduce sources of noise in our benchmarks. It's quite possible that the issue with noisy neighbours is real, and doesn't happen to us because we don't have neighbours. The point is: measure your own systems; don't blindly believe stuff you read on the internet.
Conclusion
By measuring our system and analyzing the data in different ways we were able to disprove one of the assumptions we had made when building our system, namely that there are good and bad EC2 instances. As it turns out the variance in performance between different test runs does not correlate with the clusters the tests are run on.
Note: This was originally published on the MongoDB Engineering Blog on April 30, 2019 here by Henrik Ingo and myself. Please read it there assuming the link works. I have copied it here to ensure the content does not disappear. The links in the article are the original links.
In an effort to improve repeatability, the MongoDB Performance team set out to reduce noise on several performance test suites run on EC2 instances. At the beginning of the project, it was unclear whether our goal of running repeatable performance tests in a public cloud was achievable. Instead of debating the issue based on assumptions and beliefs, we decided to measure noise itself and see if we could make configuration changes to minimize it.
After thinking about our assumptions and the experiment setup, we began by recording data about our current setup and found no evidence of particularly good or bad EC2 instances. However, we found that the results of repeated tests had a high variance. Given our test data and our knowledge of the production system, we had observed that many of the noisiest tests did the most IO (being either sensitive to IO latency, or bandwidth). After performing the first baseline tests, we therefore decided to focus on IO performance through testing both AWS instance types and IO configuration on those instances.
Investigate IO
As we are explicitly focusing on IO in this step, we added an IO specific test (fio) to our system. This allows us to isolate the impact of IO noise to our existing benchmarks. The IO specific tests focus on:
Operation latency
Streaming bandwidth
Random IOPs (IO per second)
We look first at the IO specific results, and then our general MongoDB benchmarks. In the below graph, we are graphing the "noise" metric as a percentage computed from (max-min)/median and lower is better. c3.8xlarge with ephemeral storage is our baseline configuration which we were using in our production environment.
i2.8xlarge shows best results with low noise on throughput and latency
The IO tests show some very interesting results.
The c3.8xlarge with EBS PIOPS shows less noise than the c3.8xlarge with its ephemeral disks. This was quite unexpected. In fact the c3.8xlarge with ephemeral storage (our existing configuration) is just about the worst choice.
The i2.8xlarge looks best all around with low noise on throughput and latency.
The c4.8xlarge shows higher latency noise than the c3.8xlarge. We would have expected any difference to favor the c4.8xlarge instances, as they are EBS optimized.
After these promising results, we examined the results of our MongoDB benchmarks next. At the time that we did this work, MongoDB had two storage engines (wiredTiger and MMAPv1), with MMAPv1 being the default, but now deprecated, option. There were differences in the results between the two storage engines, but they shared a common trend.
c3.8xlarge with PIOPS performs best with all results below 10% noise for the wiredTiger storage engine
c3.8xlarge with PIOPS performs best with most results below 10% noise for the mmap storage engine
There were no configurations that were best across the board. That said, there was a configuration with below 10% noise for all but 1 test: c3.8xlarge with EBS PIOPS. Interestingly, while i2 was the best for our focused IO tests, it was not for our actual tests.
Valuable lessons learned:
As far as repeatable results are concerned, the "local" SSDs we had been using performed worse compared to any other alternative we could have possibly chosen!
Contrary to popular belief, when using Provisioned IOPS with EBS, the performance is both good in absolute terms, and very very stable! This is true for our IO tests and our general tests. The latency of disk requests does have more variability than the SSD alternatives, but the IOPS performance was super stable. For most of our tests, the latter is the important characteristic.
The i2 instance family has a much higher performance SSD, and in fio tests showed almost zero variability. It also happens to be a very expensive instance type. However, while this instance type was indeed a great choice in theory, it turns out that our MongoDB test results were quite noisy. Upon further investigation, we learned that the noisy results were due to unstable performance of MongoDB itself. As i2.8xlarge has more RAM than c3.8xlarge, MongoDB on i2.8xlarge is able to hold much more dirty data in RAM. Flushing that much dirty data to disk was causing issues.
Switching from ephemeral to EBS disks in production
Based on the above results, we changed our production configuration to run on EBS disks instead of ephemeral SSD. (We were already running on c3.8xlarge instance types, which turned out to have the lowest noise in the above comparison, so decided to keep using those.)
Performance becomes more stable when using EBS
After running with the changes for a couple of weeks, you could clearly see how the day-to-day variation of test results decreased dramatically. This instantly made the entire System Performance project more useful to the development team and MongoDB as a whole.
Conclusion
Focusing on IO performance proved useful. As it turns out using Ephemeral (SSD) disks was just about the worst choice for our performance test. Instead, using Provisioned IOPS showed the most stable rate results. While i2 instances were the best in our non-MongoDB benchmark tests, they proved less than ideal in practice. This highlights quite clearly that you need to measure your actual system and assume nothing to get the best results.
Putting down my book, I stood up from the bench and walked over to my 10-year-old son by the water. His fishing line was tangled. Again. This was the third time he had needed me to fix something. He hadn't caught a single fish and was getting very upset. He loved the idea of fishing and had visions of catching impressive fish like those caught in the videos he watched. Sadly, he was not good at fishing and neither was I.
I recently wrote about how to read academic papers in volume. When I researched how to read academic papers, I also learned how to read more effectively in general. Those skills have helped me better achieve my goals, such as helping my son catch fish.
This post covers how I use books to answer my bigger questions, and is largely based on ideas from the book How to Read a Book by Mortimer Adler.
My son holding a small fish he caught.
Learning Through Books
To help my son catch fish, I had to learn both facts and skills. I needed to learn about a subject (fishing) and a skill (how to catch fish). It was one of my larger questions, requiring time and effort. I’ve investigated other larger questions focused on work problems such as working with a challenging colleague, personal goals such as remembering things better, and personal challenges such as supporting my family with a medical issue. The best way to learn facts and skills quickly is to learn from those who have already learned the topic. Books are a treasure trove of other people’s learnings.
I follow three main steps on a learning project:
Find many potential resources
Filter those results to a manageable number of the best resouces
Extract what I need from those resources.
In my life I am constantly asking questions and searching for answers. Only a few of those questions merit the time and effort required for this process. For those that do, I adjust my effort to my question and stop when I have what I need.
Find Many Potential Resources
I start with a wide search using the internet and my local library. I also ask friends, colleagues, and social media for suggestions. When I do this right, I turn up a lot of resources. For each resource, I’ll quickly check what I can about it, such as summaries and reviews, to see whether I think this book might be on topic. Key word searches often turn up things that are clearly unrelated to my question. For example, Incredible--and True!--Fishing Stories may or may not be entertaining, but it’s not going to help my son catch fish. I can immediately reject that book.
My search extends beyond books to include articles, blogs, podcasts, and videos. Books tend to be higher quality and I have a personal bias to the written word, but I want the best available resources regardless of its medium.
Then I do a second search based on the results from the first search. Did I find other search terms? What other resources are related to these? Do any of these books reference other resources? Filter For The Best Resources
Now I have a large list of books and other resources. I request as many of the books as I can from my local library. I download or bookmark the online resources. Then I scan all of these together quickly so that I can think about the ideas from multiple books at the same time. Speed is essential for that mixing of ideas. For each book I want to know:
What is this book about?
How does it address my question? What techniques does it propose?
What words does it use for my question? What do they mean?
Do I believe the answers this book proposes? Alternatively, is my bullshit detector going off?
I quickly inspect each book, scanning the table of contents, reading the publisher's blurb, skimming the end of the last chapter, and checking for summaries at the end of key chapters. I take notes on anything that addresses my prompts, anything that catches my attention, and any new questions that arise as I read. By the time I’m done, the books are usually covered in sticky notes.
I look for common words and ideas, and I usually see patterns across the books. Sometimes several of the books have the same "revolutionary" or "game-changing" ideas. This used to annoy me, but I’ve since learned this is a great result. This common “revolutionary” idea is likely what I'm looking for. Other times I learn from overlapping words and ideas in the books, even if the books don't agree on everything. When they disagree I can see which ideas stand up to criticism and which fall over.
At this point, I have two follow-up questions:
Does one book capture a common idea better than the others?
Are there interesting differences between the books?
If one book does capture the key idea better than the others, I focus on that one. When there are interesting differences, I learn more from reading the books together than by reading them separately, just as I learned more from scanning them together.
Extract Answers
I now have at least one book to read deeply. First, I revisit my existing notes to answer questions: What do I expect to get out of each book? What is common between them? What words do they use for important items? Where do they differ?
From these answers I form focused questions for each book: Book A says X, what does Book B say about that? Book C and D seem to differ on point C. Is one of them right? Is there something more complicated going on? Book E claims point D. What’s the evidence for it?
Next, I read each book, trying to answer my questions, still taking copious notes. I listen for the conversations among the books. The differences among books may be true disagreements requiring real thought and evaluation on my part. Or they may merely be different framings of the same idea. The common themes become clearer, and the differences enlighten me. In both cases I end up with a deeper understanding of the underlying issue.
When I’ve finished reading everything, I review and organize my notes. I often write a summary for myself. I hopefully have answers to my questions. If I don’t, I restart the process by looking for more sources focused on whatever is missing. If I’m really excited about the result, I may write a blog post or share my learnings with others.
Catching Fish
That day that I took my son fishing, I asked him two questions when we were back home: Would you like my help figuring out how to catch fish? Yes, he did. I told him if he wanted my help, we had to use the goal of "catch fish — any kind of fish." We couldn't only aim for the big fish he'd seen in videos. Would that still be worthwhile? He thought briefly: Yes, it would be.
I then got every book about fishing I could from my local library. I scanned each of them and noticed trends. It was clear that we should start by targetting small fish such as sunfish, with small hooks and bobbers, and we should fish in smaller bodies of water. I bought a couple of the more promising books, as well as the appropriate fishing gear, including the small hooks and bobbers. We then went to a local pond and he caught fish! That summer he caught a lot of fish. It was wonderful for him, and wonderful for me to help my son succeed at something that he loved so much.
I hope this post helps you achieve similar success with your large questions. I would love to hear about it when it does.
I sat at my desk with a pile of academic papers next to me waiting to be read. I worked at a research lab and reading papers was part of my job. My colleagues amazed me by reading scores of academic papers, calling up the right paper at the right time. I couldn’t compete. I couldn’t even keep up. I had received my Ph.D. a few years prior and felt I should have been able to. I wondered if I just didn’t belong at a research lab.
Then I wondered if I was missing something. I searched the internet and quickly found I was. I found Steve McConnel’s How to Read a Technical Article and Greg Phillips How to read technical papers—in quantity! Steve McConnel’s article was itself based upon (and acknowledged) How to Read a Book, the classic by Mortimer Adler. I learned that efficient reading is a learnable skill, just like any other. Here is what I wish I had been taught when I started grad school.
First, a caveat. If you are in school, you need to learn to fully read individual technical papers, in detail and considering every aspect, before you can read them in volume.
I am not an academic. While I have a Ph.D. and used to work in a research lab, I am not paid to do research or to publish papers. Yet I still find it valuable to read papers such as conference proceedings and journals, as well as blog posts and white papers. Reading helps me to stay up to date in my field and to do my job better. Adding other people’s ideas to my experiences helps me to come up with better solutions to my technical problems.
I am paid to solve problems, not to read. Therefore, I must make the most of my reading time. I cannot read everything. Instead, I read papers through the lens of my problems.
Selecting Papers to Read
I read papers in three different situations, all in service of doing my job better:
I’m trying to solve a specific technical problem.
I’m keeping up on a general professional interest.
A colleague sends me something interesting.
When I try to solve a technical problem, it often involves a lot of very focused reading. I cast a wide net for papers, using keyword searches in Google Scholar, tracing references from other papers, and asking colleagues in person and beyond. I generate a large pile of papers that need to be thinned into a manageable collection.
For example, I collected and summarized papers on flaky tests for my colleagues. We run a very large number of correctness tests to ensure our software works properly and without bugs. Flaky tests—tests that sproadically fail—are a distraction. They slow development and they increase the risk of bugs slipping into our code base. Based on my reading, we reduced the pain of flaky tests.
Keeping up on general professional interests is a more continual background activity. I am an expert on performance testing of software. I follow academic literature on the subject, keep an eye out for relevant industrial papers, and look out for other resources, all so that I can remain an expert in the field. Important conferences are a rich source of academic papers in one place.
Finally, I enjoy new and interesting ideas. Colleagues forward things to me since they know I appreciate when they do so. These papers may be performance related, performance adjacent, or touch on other interests of mine such as peer groups, technical education, and DEI, among others.
I suspect that I could fill all my time reading the papers I accumulate and still not read all of them. I must be efficient if I want to get the most out of them.
How I Read Papers
When I have a set of papers to read I follow a specific process. I take the first paper and set a timer for 5 minutes. Within my five-minute limit, I proceed in the following order: I read the abstract, the conclusion, the introduction, and scan the figures in the paper. Doing so gives me the best opportunity to get a sense for each paper. I actively look for and record the questions that come to my mind as I scan the papers: questions to dig deeper on, questions about the parts that confuse me. “How do they do X?” “How do they prove Y?” “Could we use Z?”
At the end of the 5 minutes I review my notes. If I have no questions, I am done with this paper. If I have questions, I put the paper aside for a deeper read specifically to answer those questions. Then I pick up the next paper to scan.
With this process I can scan 12 papers in an hour. That might not sound like much, but without my process in place, I could easily spend an hour or more fully understanding one paper.
A Deeper Read
After triaging the collection of papers, I have a smaller collection of papers, each with a list of questions to answer. I’ll pick up a promising paper. I review my notes and questions for it, then read the paper solely to answer those questions. The questions provide a focus, allowing me to read faster. If the introduction is not relevant to my question, I skip it. If I only have a question about the implementation, I go straight to the implementation section.
This all felt unnatural when I started doing it. I was not reading the paper as the author intended. That is okay. I (and you) do not owe it to the author to read their paper, nor to read it as it was “meant to be read.” Good readers and writers know this. We owe it to ourselves to get the most out of the papers we read. We only owe the authors our gratitude and an acknowledgement when we use their ideas. Sometimes I send a thank-you note to acknowledge ideas I find particularly helpful.
Remembering Papers
My wonder at my colleagues’ reading ability was not just because they read so much, but also because they remembered details and made use of those details. I must take notes if I want to do that.
I use two tools to take, organize, and remember my notes from technical papers: Zotero and Anki.
I use Zotero to organize all my academic papers. New papers go directly into a triage folder in Zotero. Zotero supports highlighting PDFs and extracting highlighted text. It also automatically collects the bibliographical data for each paper.
In Zotero, I use folders to organize papers by subject. When I want to find details on a given topic, I look through the appropriate folder and review my notes on the papers. Sometimes I rescan papers. Each part of this process is so much faster and more efficient than when I photocopied papers and stored them in a filing cabinet in graduate school.
While I can find things quickly in Zotero, simply using the tool does not put the information at the tip of my tongue. For ideas and details I want to talk about or otherwise have available in my mind, I create digital flashcards in Anki. See The Nerdiest Thing I Do for more on my Anki usage.
Reading to Learn to Read
I am able to read much more efficiently since that day sitting at my desk overwhelmed by papers. There are still people who can read and retain much more than I can, but my reading is no longer a weakness. It’s a strength.