There are indviduals who seem to work slowly, but actually get things done very quickly. I call them Slow Thinkers. They are easily overlooked, but they do amazing things. We all lose out when we ignore them.
I’d like to introduce you to them and to their more visible cousins, whom I call Fast Thinkers. I think both groups are rare – few people can compare to them. I have great respect for both and have been blessed to work with multiple Fast and Slow Thinkers; Two such individuals particularly inspire the composite characters Claire and Ed described below. While I may picture those two, Claire and Ed could be anyone possessing their skills.
I do not put myself in either of their leagues, but my habits are more aligned with the Slow Thinker’s than the Fast Thinker’s. I’ve worked with enough Fast Thinkers to know deep in my bones that I cannot and will never be able to compete directly with them. If I have to work to the standard of the Fast Thinker, I cannot give my best work. I will make mistakes. I won’t be happy, my colleagues won’t be happy, and my boss won’t be happy. I suspect that is true for many of you as well.
Image created using OpenAI's DALL·E tool.
A Fast Thinker
Paul looks around the conference table at his assembled team. He calls the group to order, asks them, “How do we solve hard problem?” and provides some background on hard problem. Sally offers her opinion on what they should do, followed by Sam, both to mixed reactions. Then Claire says, “We should do good thing,” and explains what good thing is. She continues, “We should do it because of A, B, and C. It will address the worst of hard problem quickly, and then solve it completely in a couple of months.” Good thing includes some aspects of Sally’s and Sam’s suggestions, but it is all-around better. Claire is right – they should do good thing now. Everyone agrees to her plan, they do it, and they fix the problem.
Claire is a Fast Thinker. She is very smart, comes up with correct solutions frighteningly fast, can clearly explain those solutions, and knows she is right. It is both a pleasure and intimidating to work with a Fast Thinker. Everyone listens to Fast Thinkers and they can make short work of big problems. While they are always valuable, they are extra valuable during a crisis when every minute counts. Everyone can take comfort from their confident leadership in such situations.
A Slow Thinker
A few weeks later Paul calls the same group to order again. Paul presents new hard probem. The members of the team offer their thoughts once again. There are a lot of thoughts, including some from Claire. However, this time Claire isn’t confident of her proposal, recognizing limitations to her solution. There is a lot of discussion, but there are no strong conclusions. There are a couple of promising options, but each has significant trade-offs. Towards the end of the meeting, Paul turns to Ed, “Ed, what do you think?” Many people in the room are surprised because they had forgotten that Ed was in the room. He hasn’t said anything the entire meeting. Instead, he quietly listened as each person spoke.
He starts to speak. He speaks slower than everyone else has, with a contemplative tone. Ed restates new hard problem but in a slightly different and more interesting way. He’s not sure what should be done. He calls out some of the good points made by the others but then ties the problem to a completely new idea. Ed says he would like to take a couple of days to look into this new idea and see if there’s something there. He hedges that there might not be. Paul agrees to give Ed a few days and everyone leaves. When they return a few days later, Ed shares an incredible new idea. This new idea has grown from the seed of his original thoughts. Ed has grown this seed into something beautiful. It is the correct solution and it is amazing.
Ed is a Slow Thinker. Unlike Claire, Ed does not know the correct answer right away. He has thoughts and suspicions, but he needs to think through all those thoughts and suspicions before coming to a conclusion. Those who know Ed well, know he is brilliant – just as smart as Claire, but smart in a different way. Those who don’t, see a quiet, polite man. They overlook him. Thankfully, Paul knows Ed well and makes sure to regularly ask Ed what he is thinking. Importantly, Paul listens closely when Ed answers.
The Value of Speed
Speed is treasured in the tech world. The faster the company, the team, or the individual, the more chances they have to try things, to learn, and to win big. Fortunes are made by having a good idea and being faster than the competition. This is why so many books and phrases exalt speed.
However, we need to be careful how we measure speed. The time we take to do any given task is not important. What is important is the time to get something new (a product, a feature, or a fix) to market. The Fast Thinker appears to be much faster than the Slow Thinker because they do tasks faster. They have answers immediately, not in a few days.
When measured in time to delivered value (e.g., a new product …) and delivered value per time, I think the Slow Thinker is as fast as the Fast Thinker. Yes, they may take a little longer at the start of the process, but larger problems and innovations take weeks or months. A few days of contemplation at the start can make the remaining time much more productive and shorter.
Responsibility and Rewards
Everyone recognizes the brilliance of Fast Thinkers. People listen to Fast Thinkers and do what they say (and they should). The Fast Thinkers get promoted.
It’s easy to miss the brilliance and ultimate speed of Slow Thinkers. If Paul doesn’t specifically ask Ed what he thinks in that meeting, the world could easily miss out on a great idea. That would be a shame.
The success of Fast Thinkers can lead to the marginalization of Slow Thinkers. As Fast Thinkers are promoted, they take on more responsibility, such as deciding who they will promote and whose ideas they will listen to and implement. They know the value of their quick decisions, making it easy for them to value others’ quick decisions. It’s harder for them to see the Slow Thinkers’ value, because it is different than the value they provide as a Fast Thinkers.
Don’t Ignore The Slow Thinkers
It’s easy for Fast Thinkers to ignore Slow Thinkers. It’s easy for us mere mortals to do the same. Please don’t ignore the Slow Thinkers. They are a force waiting to be unleashed. If we ignore the Eds of the world, we lose out on their ideas and all that we could learn from them. So don’t just listen to the people who speak up forcibly. Listen also for the quieter voices. See which of those quieter voices provide wonderful and impactful ideas when given the space. Then bring them your hardest problems, give them some space, and listen to what they say. Then we can really go fast.
And if you identify with the Slow Thinkers, don’t sell yourself short. Don’t get competitive and try to be faster than the Fast Thinkers around you. Do give yourself the space and time to do your best work, make sure to work on important problems, and make sure others know about your great work.
Note: This was originally published on the MongoDB Engineering Blog on April 30, 2019 here by Henrik Ingo and myself. Please read it there assuming the link works. I have copied it here to ensure the content does not disappear. The links in the article are the original links.
On the MongoDB Performance team, we use EC2 to run daily system performance tests. After building a continuous integration system for performance testing, we realized that there were sources of random variation in our platform and system configuration which made a lot of our results non-reproducible. The run to run variation from the platform was bigger than the changes in MongoDB performance that we wanted to capture. To reduce such variation - environmental noise - from our test configuration, we set out on a project to measure and control for the EC2 environments on which we run our tests.
At the outset of the project there was a lot of doubt and uncertainty. Maybe using a public cloud for performance tests is a bad idea and we should just give up and buy more hardware to run them ourselves? We were open to that possibility, however we wanted to do our due diligence before taking on the cost and complexity of owning and managing our own test cluster.
Performance benchmarks in continuous integration
MongoDB uses a CI platform called Evergreen to run tests on incoming commits. We also use Evergreen for running multiple classes of daily performance tests. In this project we are focused on our highest level tests, meant to represent actual end-user performance. We call these tests System Performance tests.
For _System Performance_tests, we use EC2 to deploy real and relatively beefy clusters of c3.8xlarge nodes for various MongoDB clusters: standalone servers, 3 Node Replica Sets, and Sharded Clusters. These are intended to be representative of how customers run MongoDB. Using EC2 allows us to flexibly and efficiently deploy such large clusters as needed. Each MongoDB node in the cluster is run on its own EC2 node, and the workload is driven from another EC2 node.
Repeatability
There's an aspect of performance testing that is not obvious and often ignored. Most benchmarking blogs and reports are focusing on the maximum performance of a system, or whether it is faster than some competitor system. For our CI testing purposes, we primarily care about repeatability of the benchmarks. This means, the same set of tests for the same version of MongoDB on the same hardware should produce the same results whether run today or in a few months. We want to be able to detect small changes in performance due to our ongoing development of MongoDB. A customer might not get very upset about a 5% change in performance, but they will get upset about multiple 5% regressions adding up to a 20% regression.
The easiest way to avoid the large regressions is to identify and address the small regressions promptly as they happen, and stop the regressions getting to releases or release candidates. We do want to stress MongoDB with a heavy load, but, achieving some kind of maximum performance is completely secondary to this test suite’s goal of detecting changes.
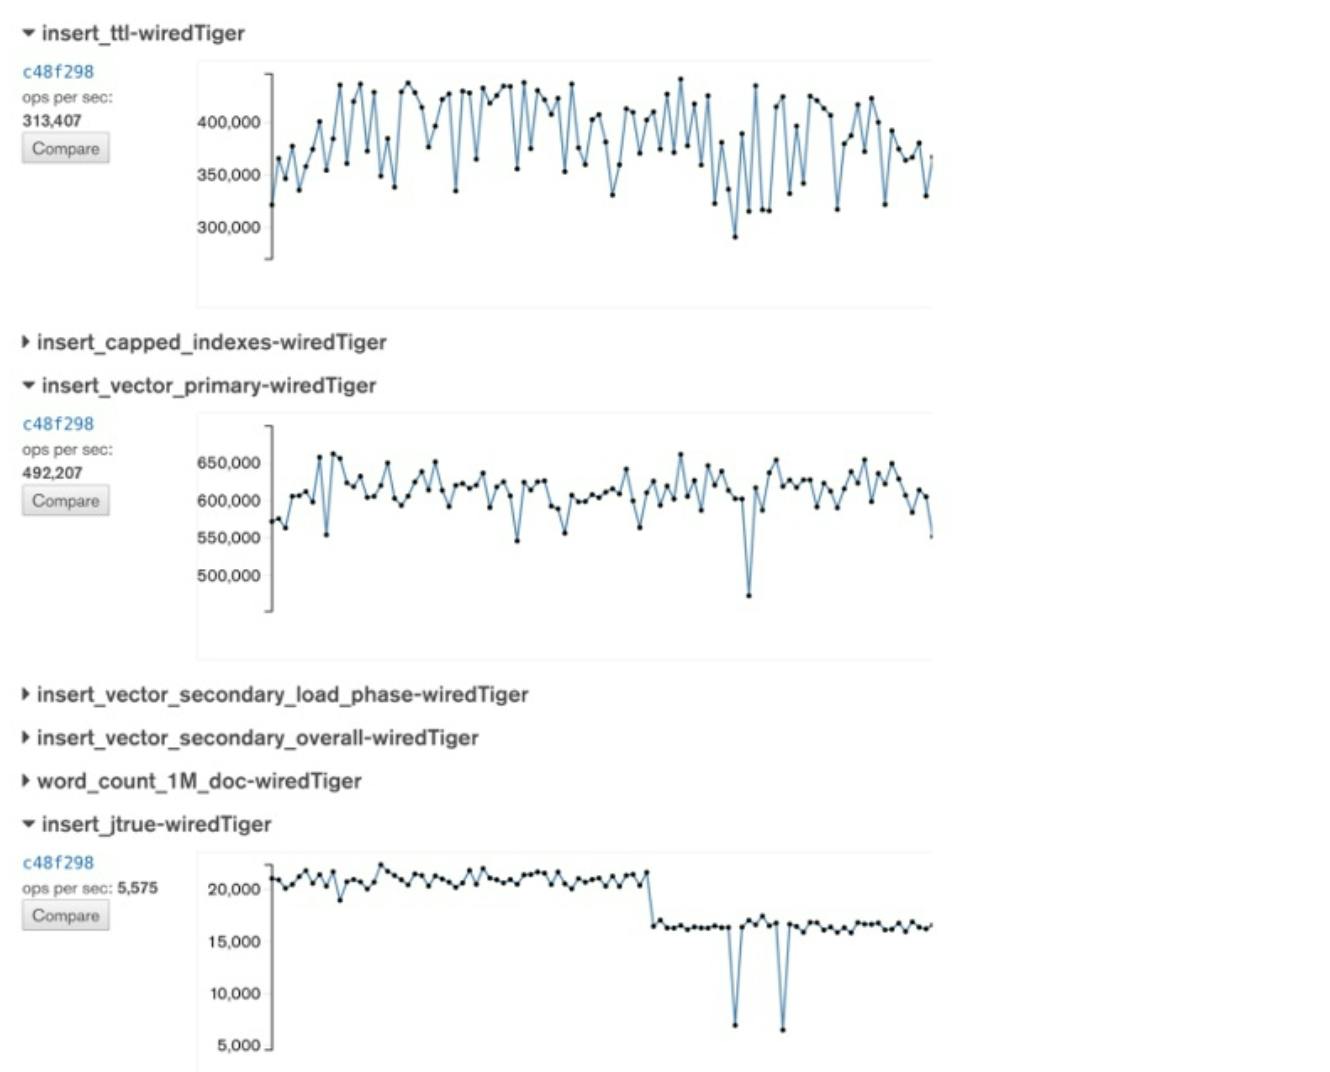
For some of our tests, repeatability wasn't looking so good. In the below graph, each dot represents a daily build (spoiler -- you’ll see this graph again):
Variability in daily performance tests
Eyeballing the range from highest to lowest result, the difference is over 100,000 documents / second from day to day. Or, as a percentage, a 20-30% range.
Investigation
To reduce such variation from our test configuration, we set out on a project to reduce any environmental noise. Instead of focusing on the difference between daily MongoDB builds, we ran tests to focus on EC2 itself.
Process: Test and Analyze
Benchmarking is really an exercise of the basic scientific process:
Try to understand a real world phenomenon, such as an application that uses MongoDB
Create a model (aka benchmark) of that phenomenon (this may include setting a goal, like "more updates/sec")
Measure
Analyze and learn from the results
Repeat: do you get the same result when running the benchmark / measuring again?
Change one variable (based on analysis) and repeat from above
We applied this benchmarking process to evaluate the noise in our system. Our tests produce metrics measuring the average operations per second (ops/sec). Occasionally, we also record other values but generally we use ops/sec as our result.
To limit other variables, we locked the mongod binary to a stable release (3.4.1) and repeated each test 5 times on 5 different EC2 clusters, thus producing 25 data points.
We used this system to run repeated experiments. We started with the existing system and considered our assumptions to create a list of potential tests that could help us determine what to do to decrease the variability in the system. As long as we weren’t happy with the results we returned to this list and picked the most promising feature to test. We created focused tests to isolate the specific feature, run the tests and analyze our findings. Any workable solutions we found were then put into production.
For each test, we analyzed the 25 data points, with a goal of finding a configuration that minimizes this single metric:
range = (max - min) / median
Being able to state your goal as a single variable such as above is very powerful. Our project now becomes a straightforward optimization process of trying different configurations, in order to arrive at the minimum value for this variable. It's also useful that the metric is a percentage, rather than an absolute value. In practice, we wanted to be able to run all our tests so that the range would always stay below 10%.
Note that the metric we chose to focus on is more ambitious than, for example, focusing on reducing variance. Variance would help minimize the spread of most test results, while being fairly forgiving about one or two outliers. For our use case, an outlier represents a false regression alert, so we wanted to find a solution without any outliers at all, if possible.
Any experiment of this form has a tension between the accuracy of the statistics, and the expense (time and money) of running the trials. We would have loved to collect many more trials per cluster, and more distinct clusters per experiment giving us higher confidence in our results and enabling more advanced statistics. However, we also work for a company that needed the business impact of this project (lower noise) as soon as possible. We felt that the 5 trials per cluster times 5 clusters per experiment gave us sufficient data fidelity with a reasonable cost.
Assume nothing. Measure everything.
The experimental framework described above can be summarized in the credo of: Assume nothing. Measure everything.
In the spirit of intellectual honesty, we admit that we have not always followed the credo of Assume nothing. Measure everything, usually to our detriment. We definitely did not follow it when we initially built the System Performance test suite. We needed the test suite up as soon as possible (preferably yesterday). Instead of testing everything, we made a best effort to stitch together a useful system based on intuition and previous experience, and put it into production. It’s not unreasonable to throw things together quickly in time of need (or as a prototype). However, when you (or we) do so, you should check if the end results are meeting your needs, and take the results with a large grain of salt until thoroughly verified. Our system gave us results. Sometimes those results pointed us at useful things, and other times they sent us off on wild goose chases.
Existing Assumptions
We made a lot of assumptions when getting the first version of the System Performance test suite up and running. We will look into each of these in more detail later, but here is the list of assumptions that were built into the first version of our System Performance environment:
Assumptions:
A dedicated instance means more stable performance
Placement groups minimize network latency & variance
Different availability zones have different hardware
For write heavy tests, noise predominantly comes from disk
Ephemeral (SSD) disks have least variance
Remote EBS disks have unreliable performance
There are good and bad EC2 instances
In addition, the following suggestions were proposed as solutions to reducing noise in the system:
Just use i2 instances (better SSD) and be done with it
Migrate everything to Google Cloud
Run on prem -- you’ll never get acceptable results in the cloud
Results
After weeks of diligently executing the scientific process of hypothesize - measure - analyze - repeat we found a configuration where the range of variation when repeating the same test was less than 5%. Most of the configuration changes were normal Linux and hardware configurations that would be needed on on-premise hardware just the same as on EC2. We thus proved one of the biggest hypotheses wrong:
You can't use cloud for performance testing
With our first experiment, we found that there was no correlation between test runs and the EC2 instances they were run on. Please note that these results could be based on our usage of the instance type; you should measure your own systems to figure out the best configuration for your own system. You can read more about the specific experiment and its analysis in our blog post EC2 instances are neither good nor bad.
There are good and bad EC2 instances
After running the first baseline tests, we decided to investigate IO performance. Using EC2, we found that by using Provisioned IOPS we get a very stable rate of disk I/O per second. To us, it was surprising that ephemeral (SSD) disks were essentially the worst choice. After switching our production configuration from ephemeral SSD to EBS disks, the variation of our test results decreased dramatically. You can read more about our specific findings and how different instance types performed in our dedicated blog post EBS instances are the stable option.
Ephemeral (SSD) disks have least variance
Remote EBS disks have unreliable performance -> PIOPS
Just use i2 instances (better SSD) and be done with it (True in theory)
Next, we turned our attention to CPU tuning. We learned that disabling CPU options does not only stabilize CPU-bound performance results. In fact, noise in IO-heavy tests also seems to go down significantly with CPU tuning.
For write heavy tests, noise predominantly comes from disk
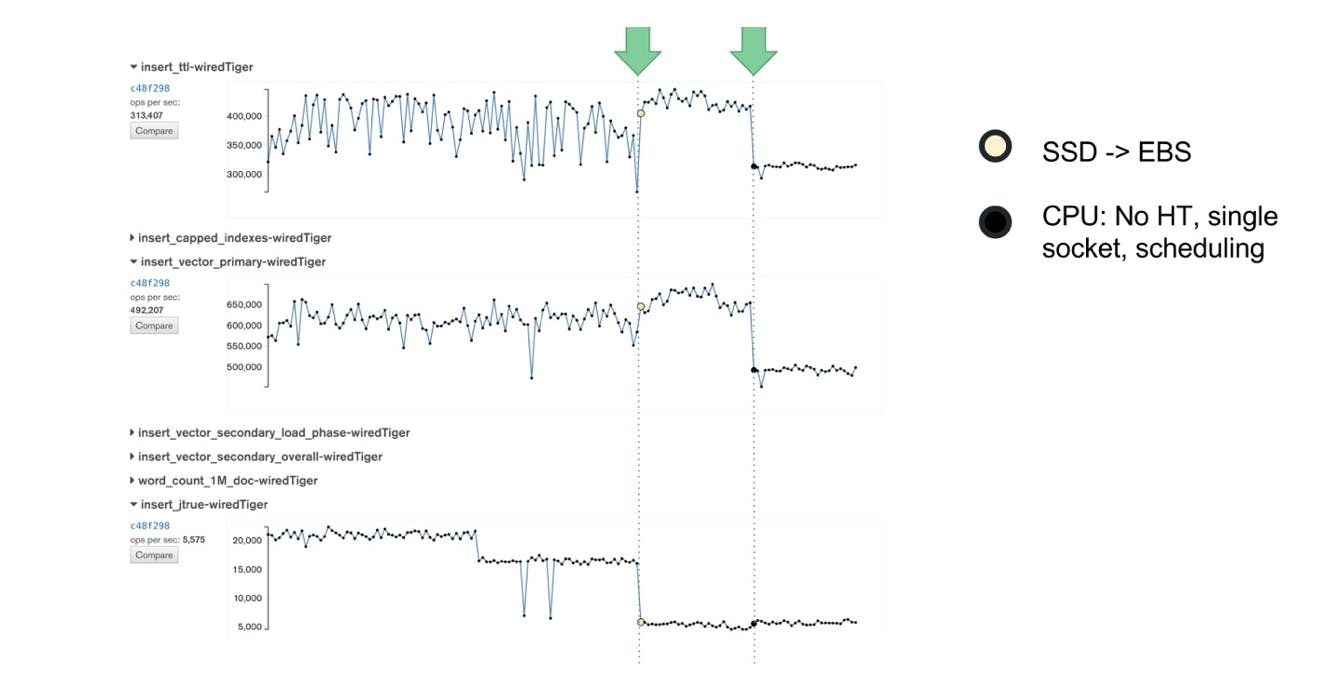
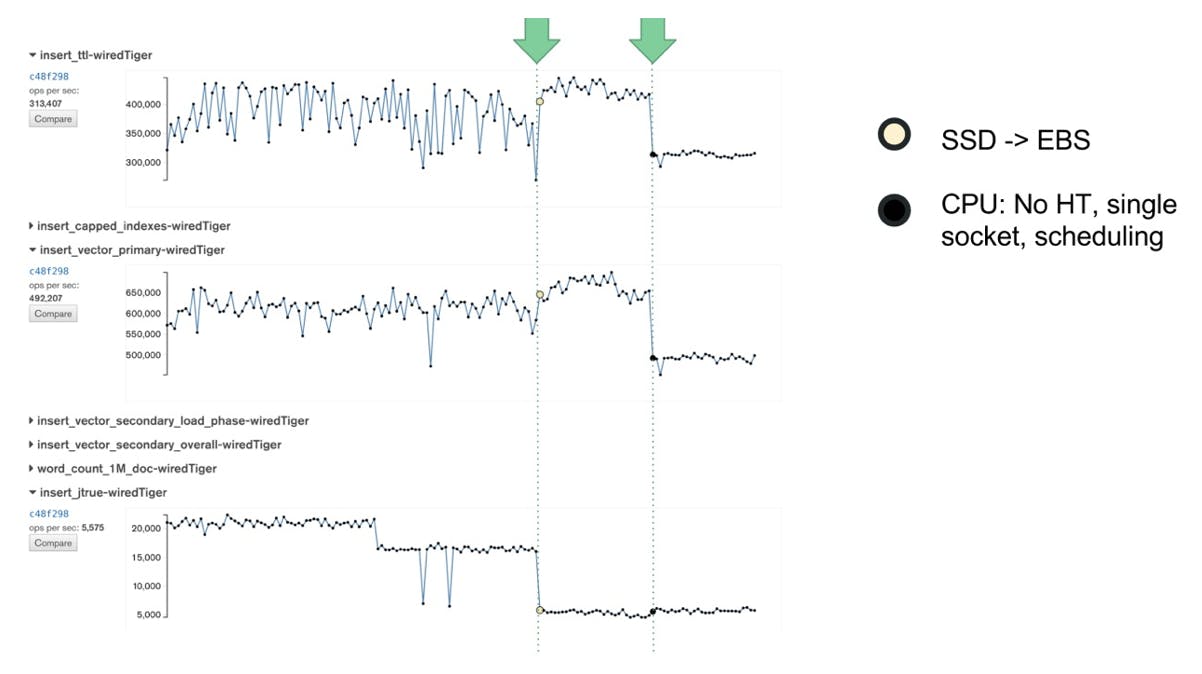
After we disabled CPU options, the variance in performance decreased again. In the below graph you can see how changing from SSD to EBS and disabling CPU options reduced the performance variability of our test suite. You can read more about the CPU options we tuned in our blog post Disable CPU options.
Improvements in daily performance measurements through changing to EBS and disabling CPU options
At the end of the project we hadn’t tested all of our original assumptions, but we had tested many of them. We still plan to test the remaining ones when time and priority allow:
A dedicated instance means more stable performance
Placement groups minimize network latency & variance
Different availability zones have different hardware
Through this process we also found that previously suggested solutions would not have solved our pains either:
Just use i2 instances (better SSD) and be done with it (True in theory)
Migrate everything to Google Cloud: Not tested!
Conclusion of the tests
In the end, there was still noise in the system, but we had reduced it sufficiently that our System Performance tests were now delivering real business value to the company. Every bit of noise bothers us, but at the end of the day we got to a level of repeatability in which test noise was no longer our most important performance related problem. As such, we stopped the all out effort on reducing system noise at this point.
Adding in safeguards
Before we fully moved on to other projects, we wanted to make sure to put up some safeguards for the future. We invested a lot of effort into reducing the noise, and we didn’t want to discover some day in the future that things had changed and our system was noisy again. Just like we want to detect changes in the performance of MongoDB software, we also want to detect changes in the reliability of our test platform.
As part of our experiments, we built several canary benchmarks which give us insights into EC2 performance itself based on non-MongoDB performance tests. We decided to keep these tests and run them as part of every Evergreen task, together with the actual MongoDB benchmark that the task is running. If a MongoDB benchmark shows a regression, we can check whether a similar regression can be seen in any of the canary benchmarks. If yes, then we can just rerun the task and check again. If not, it's probably an actual MongoDB regression.
If the canary benchmarks do show a performance drop, it is possible that the vendor may have deployed upgrades or configuration changes. Of course in the public cloud this can happen at arbitrary times, and possibly without the customers ever knowing. In our experience such changes are infrequently the cause for performance changes, but running a suite of "canary tests" gives us visibility into the day to day performance of the EC2 system components themselves, and thus increases confidence in our benchmark results.
The canary tests give us an indication of whether we can trust a given set of test results, and enables us to clean up our data. Most importantly, we no longer need to debate whether it is possible to run performance benchmarks in a public cloud because we measure EC2 itself!
Looking forward
This work was completed over 1.5 years ago. Since that time it has provided the foundation that all our subsequent and future work has been built upon. It has led to 3 major trends:
We use the results. Because we lowered the noise enough, we are able to regularly detect performance changes, diagnose them, and address them promptly. Additionally, developers are also "patch testing" their changes against System Performance now. That is, they are using System Performance to test the performance of their changes before they commit them, and address any performance changes before committing their code. Not only have we avoided regressions entering into our stable releases, in these cases we’ve avoided performance regressions ever making it into the code base (master branch).
We’ve added more tests. Since we find our performance tests more useful, we naturally want more such tests and we have been adding more to our system. In addition to our core performance team, the core database developers also have been steadily adding more tests. As our system became more reliable and therefore more useful, the motivation to create tests across the entire organization has increased. We now have the entire organization contributing to the performance coverage.
We’ve been able to extend the system. Given the value the company gets from the system, we’ve invested in extending the system. This includes adding more automation, new workload tools, and more logic for detecting when performance changes. None of that would have been feasible or worthwhile without lowering the noise of the System Performance tests to a reasonable level. We look forward to sharing more about these extensions in the future.
Coda: Spectre/Meltdown
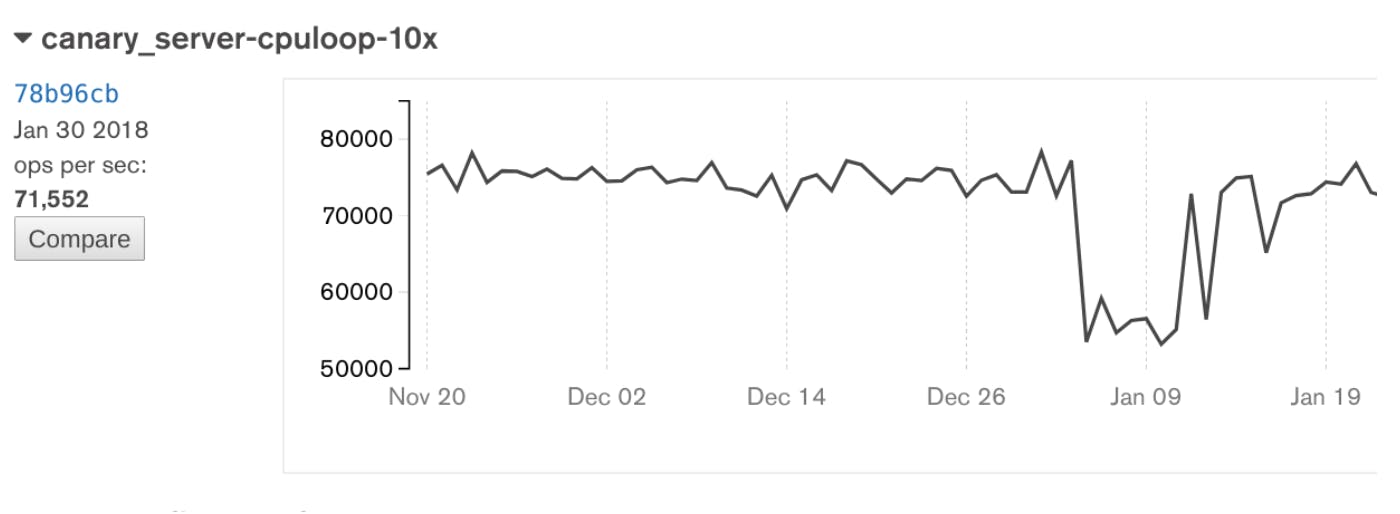
As we came back from the 2018 New Years holidays, just like everyone else we got to read the news about the Meltdown and Spectre security vulnerabilities. Then, on January 4, all of our tests went red! Did someone make a bad commit into MongoDB, or is it possible that Amazon had deployed a security update with a performance impact? I turned out that one of our canary tests - the one sensitive to cpu and networking overhead - had caught the 30% drop too! Later, on Jan 13, performance recovered. Did Amazon undo the fixes? We believe so, but have not heard it confirmed.
Performance drops on January 4th and bounces back on January 13th
The single spike just before Jan 13 is a rerun of an old commit. This confirms the conclusion that the change in performance comes from the system, as running a Jan 11 build of MongoDB after Jan 13, will result in higher performance. Therefore the results depend on the date the test was run, rather than which commit was tested.
As the world was scrambling to assess the performance implications of the necessary fixes, we could just sit back and watch them in our graphs. Getting on top of EC2 performance variations has truly paid off.
Update: @msw pointed us to this security bulletin, confirming that indeed one of the Intel microcode updates were reverted on January 13.
Note: This was originally published on the MongoDB Engineering Blog on April 30, 2019 here by Henrik Ingo and myself. Please read it there assuming the link works. I have copied it here to ensure the content does not disappear. The links in the article are the original links.
In an effort to improve repeatability, the MongoDB Performance team set out to reduce noise on several performance test suites run on EC2 instances. At the beginning of the project, it was unclear whether our goal of running repeatable performance tests in a public cloud was achievable. Instead of debating the issue based on assumptions and beliefs, we decided to measure noise itself and see if we could make configuration changes to minimize it.
We already built up knowledge around fine-tuning CPU options when setting up another class of performance benchmarks (single node benchmarks). That work had shown us that CPU options could also have a large impact on performance. Additionally, it left us familiar with a number of knobs and options we could adjust.
Knob
Where to set
Setting
What it does
Idle Strategy
Kernel Boot
idle=poll
Puts linux into a loop when idle, checking for work.
Max sleep state (c4 only)
Kernel Boot
intel_idle.max_cstate=1 intel_pstate=disable
Disables the use of advanced processor sleep states.
CPU Frequency
Command Line
sudo cpupower frequency-set -d 2.901GHz
Sets a fixed frequency. Doesn't allow the CPU to vary the frequency for power saving.
Hyperthreading
Command Line
echo 0 > /sys/devices/system/ cpu/cpu$i/online
Disables hyperthreading. Hyperthreading allows two software threads of execution to share one physical CPU. They compete against each other for resources.
We added some CPU specific tests to measure CPU variability. These tests allow us to see if the CPU performance is noisy, independently of whether that noise makes MongoDB performance noisy. For our previous work on CPU options, we wrote some simple tests in our C++ harness that would, for example:
multiply numbers in a loop (cpu bound)
sleep 1 or 10 ms in a loop
Do nothing (no-op) in the basic test loop
We added these tests to our System Performance project. We were able to run the tests on the client only, and going across the network.
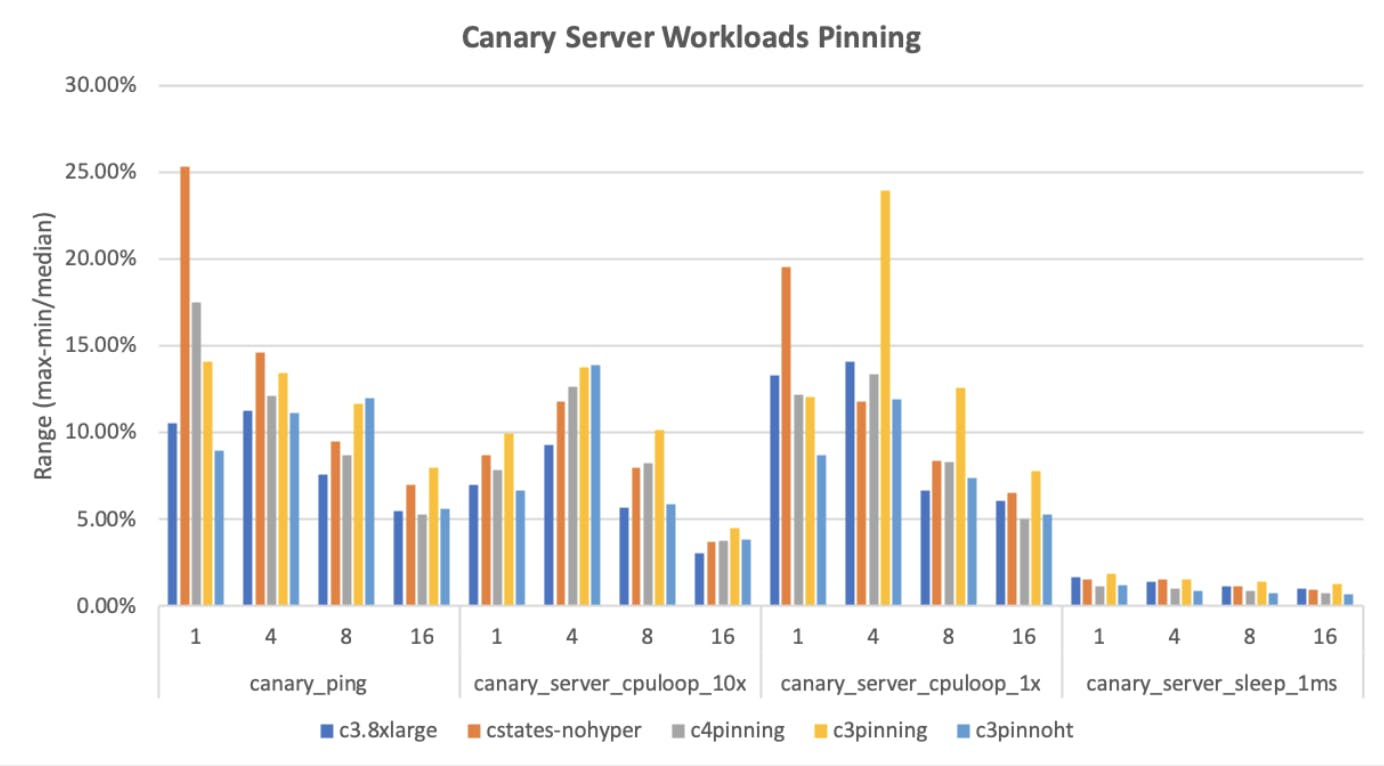
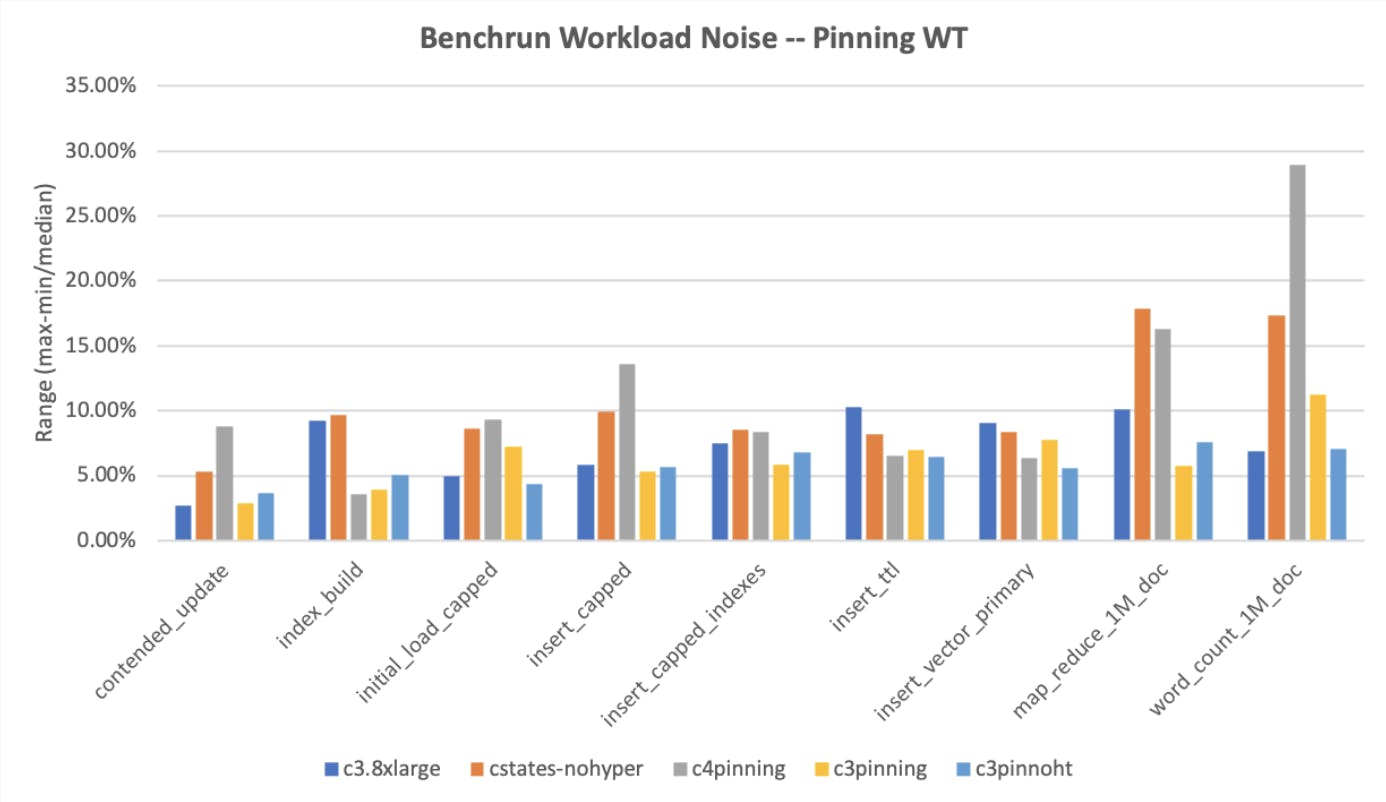
We ran our tests 5x5 times, changing one configuration at a time, and compared the results. The first two graphs below contain results for the CPU-focused benchmarks, the third contains the MongoDB-focused benchmarks. In all the below graphs, we are graphing the "noise" metric as a percentage computed from (max-min)/median and lower is better.
We start with our focused CPU tests, first on the client only, and then connecting to the server. We’ve omitted the sleep tests from the client graphs for readability, as they were essentially 0.
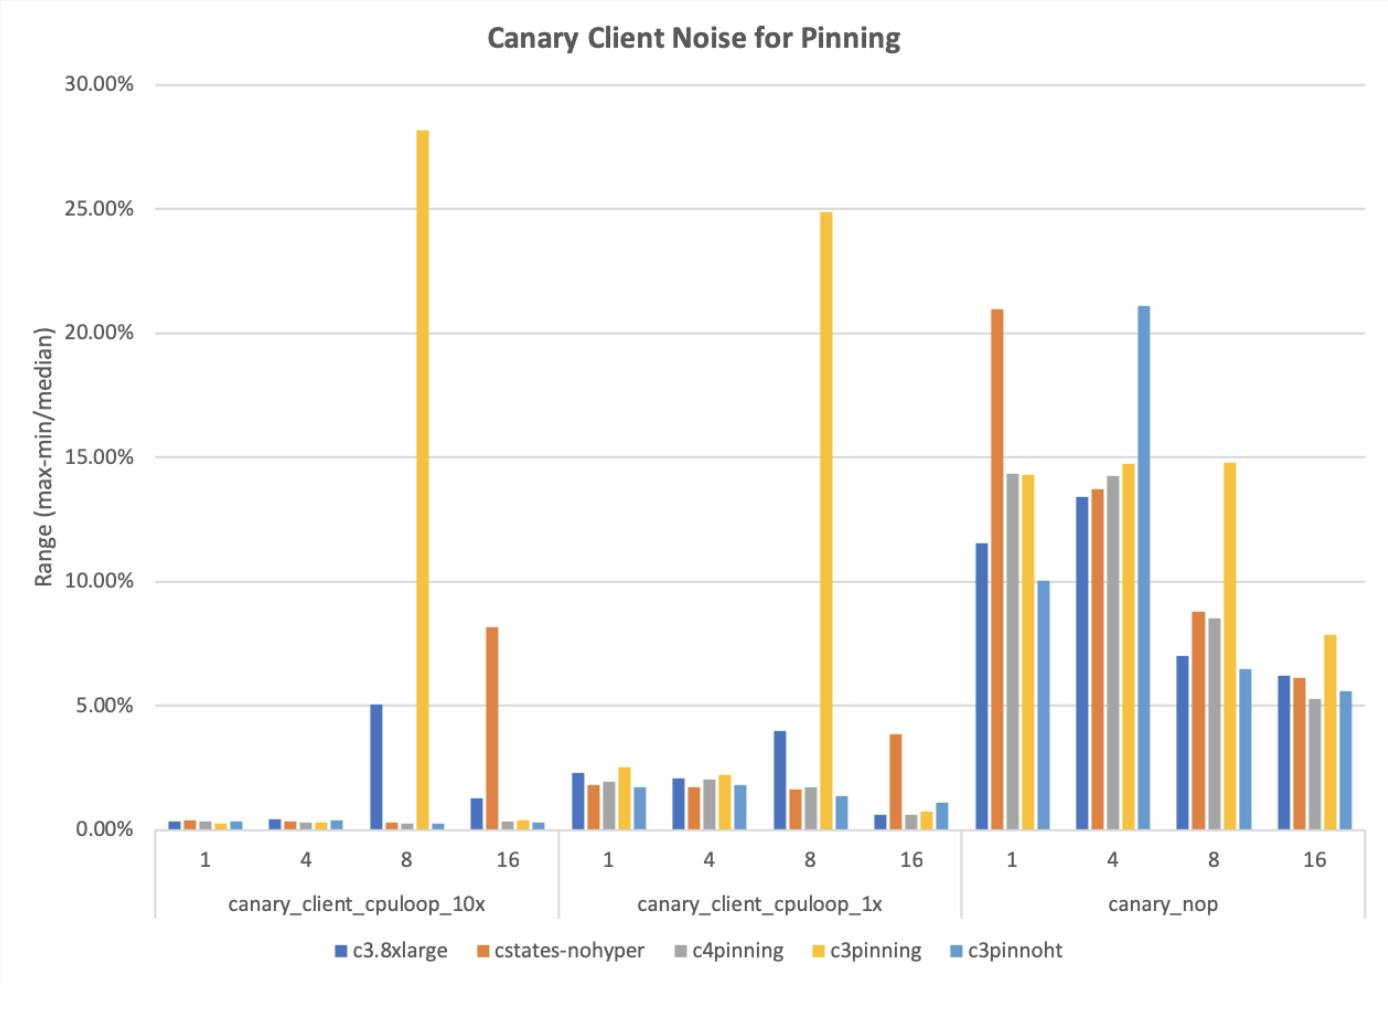
Results for CPU-focused benchmarks with different CPU options enabled
The nop test is the noisiest test all around, which is reasonable because it’s doing nothing in the inner loop. The cpu-bound loop is more interesting. It is low on noise for many cases, but has occasional spikes for each case, except for the case of the c3.8xlarge with all the controls on (pinned to one socket, hyperthreading off, no frequency scaling, idle=poll).
Results for tests run on server with different CPU options enabled
When we connect to an actual server, the tests become more realistic, but also introduce the network as a possible source of noise. In the cases in which we multiply numbers in a loop (cpuloop) or sleep in a loop (sleep), the final c3.8xlarge with all controls enabled is consistently among the lowest noise and doesn’t do badly on the ping case (no-op on the server). Do those results hold when we run our actual tests?
Results for tests run on server with different CPU options enabled
Yes, they do. The right-most blue bar is consistently around 5%, which is a great result! Perhaps unsurprisingly, this is the configuration where we used all of the tuning options: idle=poll, disabled hyperthreading and using only a single socket.
We continued to compare c4 and c3 instances against each other for these tests. We expected that with the c4 being a newer architecture and having more tuning options, it would achieve better results. But this was not the case, rather the c3.8xlarge continued to have the smallest range of noise. Another assumption that was wrong!
We expected that write heavy tests, such as batched inserts, would mostly benefit from the more stable IOPS on our new EBS disks, and the CPU tuning would mostly affect cpu-bound benchmarks such as map-reduce or index build. Turns out this was wrong too - for our write heavy tests, noise did not in fact predominantly come from disk.
The tuning available for CPUs has a huge effect on threads that are waiting or sleeping. The performance of threads that are actually running full speed is less affected - in those cases the CPU runs at full speed as well. Therefore, IO-heavy tests are affected a lot by CPU-tuning!
Disabling CPU options in production
Deploying these configurations into production made insert tests even more stable from day to day:
Improvements in daily performance measurements through changing to EBS and disabling CPU options
Note that the absolute performance of some tests actually dropped, because the number of available physical CPUs dropped by ½ due to only using a single socket, and disabling hyperthreading causes a further drop, though not quite a full half, of course.
Conclusion
Drawing upon prior knowledge, we decided to fine tune CPU options. We had previously assumed that IO-heavy tests would have a lot of noise coming from disk and that CPU tuning would mostly affect CPU-bound tests. As it turns out, the tuning available for CPUs actually has a huge effect on threads that are waiting or sleeping and therefore has a huge effect on IO-heavy tests. Through CPU tuning, we achieved very repeatable results. The overall measured performance in the tests decreases but this is less important to us. We care about stable, repeatable results more than maximum performance.
Note: This was originally published on the MongoDB Engineering Blog on January 30, 2023 here. Please read it there assuming the link works. I have copied it here to ensure the content does not disappear.
At MongoDB, we want to (honestly) tell our users that each new version of our software is faster than the previous version. We also want to be able to explain why. We definitely do not want to learn that a release is slower (we have a performance regression) from our customers telling us after discovering it for themselves. In order to do this, we need to understand the performance of our software, detect performance changes early, and aggressively redress the root cause.
We have invested significantly into building a performance testing system to achieve these goals. This includes creating a large number of performance tests, automating the running of those tests, and building tools to diagnose performance regressions when we find them. Those tools and tests are not enough by themselves: they produce an overwhelming amount of data. That data needs to be analyzed to determine if the performance changed. We could not process it all. We have developed new tools to process the data, using advanced statistical techniques to detect real performance regressions and identify the causes of those regressions.
Where we started
We built our original performance testing system in 2015. It ran a collection of performance tests directly in our CI system (Evergreen). We automated every step of running a test and collecting the results. That left the hard part: making sense of the results.
Computers are fascinating things, built up from a huge number of simple and deterministic components. However, the interactions between those simple components lead to the emergence of non-deterministic behavior. As computers get more complex, the emergent behavior becomes more pronounced. The net effect is that when you run a program twice, the two executions will differ (i.e. one may take longer), even when run on the same machine.
The problem gets even harder when you go from running on a single computer, to multiple computers in a distributed system. Network latencies will vary depending on the state of the network switches and other traffic on the network. The combination of each computer's variability combined with the variability of the network leads to more variability. MongoDB is a distributed system. When we test the performance of MongoDB, we have to address all of these issues.
For performance tests, these differences show up as different measurements of performance. Your program may take more or less time to run. It may execute more or fewer operations within a period of time. You may see more or fewer slow operations. We call this phenomenon run to run variation or measurement noise. Run to run variation makes it harder to determine if changes to the software made the software intrinsically faster or slower. Thus, we did an enormous amount of work to limit the measurement noise in our tests, both in the original project, and in subsequent projects.
Still, no matter how hard anyone tries, there will always be run to run variation. This presents a challenge when we want to interpret our performance results (or if you want to interpret your performance results). Maybe we are comparing two versions of our software and want to know which one is faster. If we have results that are 5% faster on the new version, is that due to our software being 5% faster? Or is the 5% due to run to run variation? Or worse, is the 5% change due to 10% run to run variation combined with our software actually being 5% slower?
When we started, we only had a few performance tests. We manually inspected the results and could understand if and when the performance changed. However, as we added more tests, and more results per test, human inspection became less effective: we missed things and it was hard and unsatisfying work.
We automated comparing the performance of one version of the software to another very early in the development of our system. We wrote software to compare the new performance results to older performance results. If the results changed more than 10%, we flagged it and had a human look at it.
Using a direct comparison was common practice in the industry. It was also awful. The comparisons missed small regressions, they flagged a lot of false positives on noisier tests, and sometimes they flagged real things, but at the wrong time. The automated comparisons were much better than manual inspection, but still awful.
We continually built improvements to make the system less awful. We had a system to increase the comparison threshold (from 10%) for noisier tests, and a system to reset the comparison when there was a change in performance (i.e., compare to the new normal). These changes improved the system, but they did not fundamentally overcome the challenges we faced.
Solving the right problem
Along the way, we realized we were trying to solve the wrong problem. Our automated comparison was answering the question: “Has measured performance changed more than 10% between these two versions of software”. What we really wanted to answer was “Which software changes altered performance (for better or worse)”. Those two questions overlap for large performance changes in low noise environments, but they differ on noisy tests or for small changes in performance.
The second question (“which software changes altered performance?”) focuses on detecting changes in a measured value over time. This question maps to a known problem called change point detection. Change point detection is the problem of finding when changes in values occurred in time (time-series) in the presence of noise or other confounding variables. For example, it’s used to detect changes in behavior on such things as electricity consumption, population totals, local weather, and stock prices. There’s a lot of existing work on change point detection, so we just needed to pick the best existing work, implement it, and put it into production. Simple, right?
Well, maybe not. We did not know what was the best existing work, and we did not know if it would fix our problems. So, we did some research, identifying likely techniques and collecting papers on them. The papers accumulated and stayed on my desk, because I didn’t have time to dive into a speculative project when there were plenty of things that needed to be done NOW.
Enter an intern
During the summer of 2017, two interns joined us on the performance team. They spent the summer working with us on our performance testing infrastructure. Both of them were great, giving our work an extra push forward.
We encourage our interns to learn and grow. One way we do this is by explaining what we are doing and why we are doing it. We explain the larger context of the work. This naturally leads to discussing open challenges. One of our interns asked if they could read that stack of papers sitting on my desk (of course they could). Towards the end of the summer, he had completed his summer project early. Further, he had read the papers, understood them, and asked if he could make a prototype! In particular, he had gone through the complex math of the papers, and figured out how that math could be implemented in software.
He built a prototype. It was limited, but it proved that the concept could work. The algorithm clearly found the changes in the sample traces we created, and did not get confused when run on sample data containing random background noise. Based on this initial success, we scheduled a larger proof of concept project to integrate the algorithm with our production system. We compared this second proof of concept with the existing comparison code, and determined it was MUCH better. We then did the work to get the algorithm in production and update our processes to use it.
Our production system today
When we started in 2015, we ran only a handful of tests and only a handful of people used the performance infrastructure directly. Today we run hundreds of distinct performance tests, generating over 100k distinct results per software commit. Today, everyone who develops MongoDB interacts with our performance testing infrastructure.
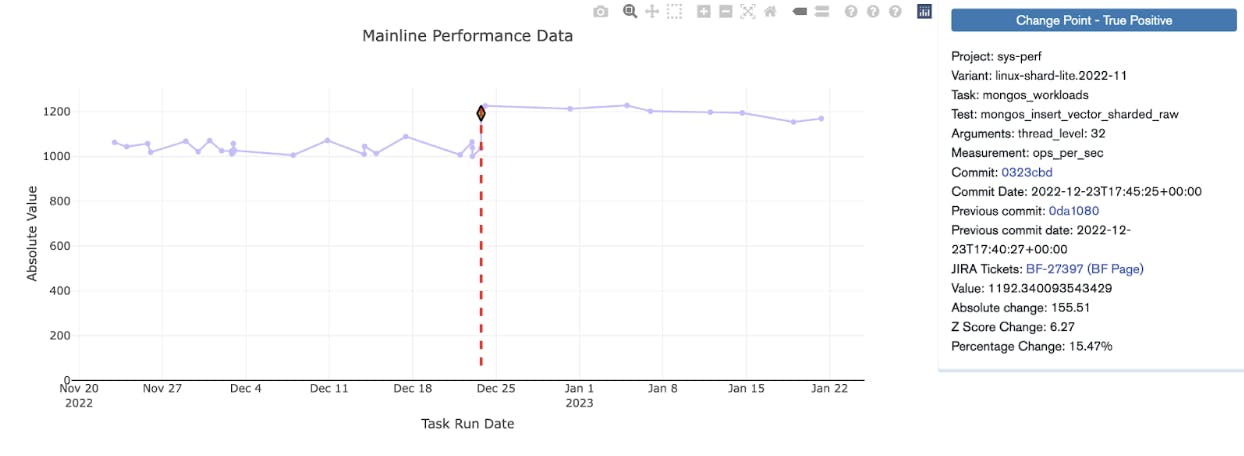
When a developer commits a change to MongoDB, tests are run. Upon completion, change point detection is used to detect performance changes (improvements and regressions). A dedicated team triages these changes, isolates them to specific commits, and assigns these changes to developers to investigate. In the case of improvements, the developers confirm that the change was expected, or investigate the change to understand why the performance got better. Sometimes things get faster because of bugs – we have found bugs this way.
Trend graph for a performance test in MongoDB. The green diamond marks the detected change point that has been triaged and confirmed. This was a recent 15% improvement in bulk insert performance for sharded clusters.
Our system is good at detecting regressions and our engineers are good at fixing them. Even better than fixing a regression, is preventing a performance regression from ever being committed to our development branch. Developers can test their proposed changes before committing the changes, using something called a patch build. In this way, the developers can make sure they are not introducing new performance regressions, verify a fix, or confirm an optimization before committing their code.
Advancing science!
At MongoDB we take pride in developing a database and a database platform that empowers developers to make applications that change the world. We depend on our performance testing infrastructure to ensure we ship a performant database. We are proud of the performance infrastructure we have built and the impact it has had on the software we ship to our users.
We do not do any of this work in a void. At MongoDB we benefit from being part of several communities, and we want to support these communities. It is for this reason that most of our database source code is publicly available and our JIRA project for database development is also public.
These talks and presentations have helped the community, but they have also helped us. By sharing and participating in the community, we have more people thinking about our problems. We’ve had the best minds in performance engineering in academia sharing ideas and suggestions with us on how to improve our technology!
Often the ideas build on each other. One such idea led to the creation of the Data Challenge Track at ICPE in 2022. Building on our papers, we were able to open up our performance test results as a shareable artifact. The data challenge itself was simple: do something interesting with our performance test data. Researchers were thrilled to have industry data to evaluate and demonstrate their ideas. We were thrilled to have researchers working on our problems. In the end, it led to four strong papers which have impacted how we test performance at MongoDB.
We continue to work on sharing our data and learnings. We have an ongoing collaboration within the SPEC Research Group to create better datasets and algorithms for detecting performance regressions. The group is combining our data with other industry datasets and curating the data. The results will enable researchers to understand the performance and accuracy of current algorithms, test new algorithms, and clearly show any improvements. All using real industry data from us and other companies.
In each of these interactions, the community wins and we win. By sharing our data we enable better research, we get to take advantage of that research, and the research is better aligned with our needs.
Investing in the future
Of the two interns mentioned in this post, one is now a full time employee of MongoDB, and the other is pursuing a Ph.D. in computer science at Columbia. One is directly improving our software, and the other one is improving the theory and tools we use to build our software. We are very proud of both of them.
The MongoDB database is faster today because of their work on our performance testing infrastructure. Thanks to that infrastructure we better understand why the database performs the way it does, why that performance changes, and when that performance changes.
We continue to invest in and improve this critical piece of our infrastructure. We have teams dedicated to extending and improving it. We lean into our academic interactions to improve the state of the art for everyone. And we invest in the people who work on these systems (interns included).
We hope you consider using these techniques yourself and letting us and the community know how it goes for you. If you are an academic, please improve the theoretical underpinnings of this entire space – we are happy to talk to you about it. And if the problems and software described in this post sounded interesting to you, we are hiring! Come join us and help us solve these problems.